This morning, I read that U.S. crude output rose 0.9% to 8.95 million barrels a day in the week ended Oct. 10. That's the most since June 1985, according to Energy Information Administration data.
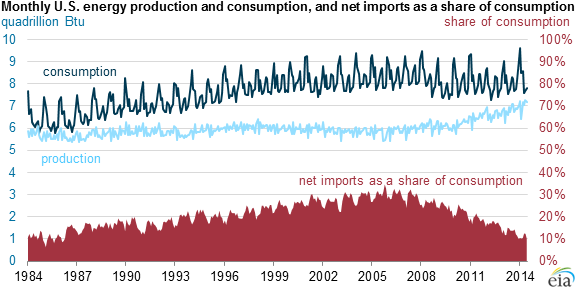
Some charts from the Energy Information Administration on U.S. energy consumption and imports are eyepopping.
First, total U.S. net imports of energy as a share of energy consumption fell to their lowest level in 29 years for the first six months of 2014.
American energy consumption grew, but it was outpaced by the rise in total energy production. As a result, we saw a 17% reduction in net imports compared with the first six months of 2013.
If you're wondering how the rise in U.S. energy production breaks down, petroleum accounted for 52% of the 2014 year-to-date increase, natural gas for 27%, renewable energy for 9%, and nuclear electric power for 2%. In contrast, total coal production fell 1%.
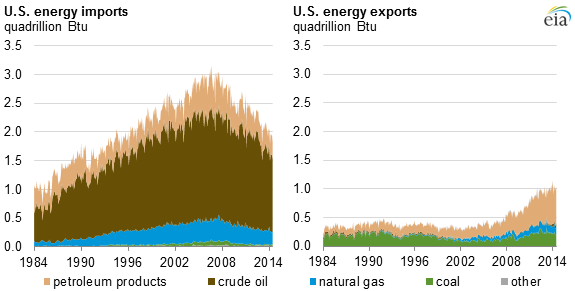
Total energy imports in the first six months of 2014 fell 6% compared with the first six months of 2013. Total energy exports increased 8% compared with the first six months of 2013. The increase was almost entirely the result of a 21% increase in petroleum product exports.
Read the whole EIA report HERE.
Meanwhile, there is support for the U.S. oil benchmark, West Texas Intermediate, around $75 per barrel.
And here is a chart showing breakeven prices among the U.S. shale plays. Notice that the costs in the Eagle Ford are generally a lot lower than in the Permian.
Also, crude oil processing volumes in China reached a record high. However, Chinese refiners are facing a "triple whammy" -- slowing economic growth, state price controls, and now a plunge in the value of stockpiled petroleum.
Just some things to keep in mind today.
And let's look at that oil price chart one more time.
(Updated chart)
A bounce looks likely, but there's no law saying it has to happen.
have a good Tuesday,
Sean
Here's a chart from Calculated Risk showing the US trade deficit, with and without petroleum.
Source
The trade gap increased 0.4% to $38.8 billion from a revised $38.6 billion in July that was smaller than previously reported. The trade deficit was a bit bigger than expected because we're importing more junk from China and we didn't export as much petroleum products as expected.
In fact, Andrew Wilkinson, chief economist of Miller Tabak, calls US petroleum product exports "curiously slack" for the second month in a row. (sorry, link not available)
Here's Andrew's chart of petroleum exports and imports
What are we to make of this? I'm not surprised to see crude oil imports remain soft, but the drop in petroleum product exports disturbs me. Are our exports being crowded out by cheaper exports from Russia and the Middle East? Or is it something else?
One thing is for sure. The US is producing more oil than it has for the past 24 years ...
Source
The Department of Energy reported yesterday that US oil production during the week ending October 18 averaged nearly 7.9 million barrels per day (bpd), the highest weekly output of crude oil in the US since March 1989, more than 24.5 years ago.
Mark Perry of the Carpe Diem blog says: "At the current pace of increases in domestic output, US oil production will likely exceed 8 million bpd next week, and is on track to surpass 9 million bpd by April 2014 and then surpass 10 million bpd by next fall."
Stay tuned.