Showing posts with label gasoline. Show all posts

Wednesday, October 22, 2014

Chart of the Day: UPS Goes Vroom-Vroom!

Check out this chart from StockCharts.com for UPS.
Visit StockCharts.com to see more great charts.

(Updated chart)

The stock reports earnings in two days. The holiday season is normally strong for UPS. It's extra-strong this year because falling gasoline prices are putting more money in consumer's pockets. Oxford
Resource Explorer subscribers are up nicely if they bought it at my recommended entry price. 

Wednesday, September 10, 2014

Top Stories and Charts on Energy and Gold for Wednesday

OPEC Says World Will Need Less of Its Oil Next Year
OPEC said demand for its crude oil will be lower than expected next year, with a surge in U.S. output potentially bringing its production to levels not seen since the past decade.

In its monthly oil-market report, the Organization of the Petroleum Exporting Countries said it had lowered the estimate of demand for its crude by 200,000 barrels a day for 2015 and by the same amount for this year. As a result, markets will need 300,000 barrels a day less of OPEC crude next year, it said.

The new OPEC demand forecast would bring its expected production next year to 29.2 million barrels a day, a level not see since the group was forced to slash its output in 2009 following a global financial crisis.

Despite lower demand for its crude, OPEC said its production rose by 231,000 barrels a day in August as Libyan oil ports and fields reopened.

READ

Commodities Fall to 8-Month Low as Brent Stays Below $100
The Bloomberg Commodity Index of 22 raw materials fell 0.3 percent by 3:24 p.m. in London after earlier declining 0.4 percent to 122.9665, the lowest since Jan. 10. The gauge declined 2.1 percent this year. Brent oil traded below $100 a barrel for a third day.

Commodities are heading for a fourth annual decline as rallying stock markets and a strengthening dollar curbed demand for an alternative investment. Oil prices are set to drop next year as U.S. crude output reaches a 45-year high, the Energy Information Administration said yesterday. The U.S. corn crop is a record high, the U.S. Department of Agriculture forecast.

READ

Cheapest US Gasoline Since 2010 Set to Get Cheaper
The average is $3.428 a gallon, down 6.2 percent since Memorial Day on May 26, AAA data show. That’s the largest decline from the start of the summer driving season since 2008. U.S. refineries operated at the highest-ever seasonal rates every week since July 4.

Processors are using domestic crude that costs less than foreign imports as horizontal drilling and hydraulic fracturing in shale formations increased output to the most since 1986. Gasoline will drop another 10 to 20 cents a gallon by the end of October as retailers switch to cheaper winter-blend fuel, said Michael Green, a Washington-based spokesman for AAA, the largest U.S. motoring group.

READ

Oil Prices That Major Producers Need to Survive


READ

Gold Advances as Drop to 3-Month Low Spurs More Buying
Assets in gold-backed exchange-traded products rose by 2.2 metric tons yesterday, snapping a six-session slide. Bullion earlier touched a three-month low. The price slump will help attract physical buyers, Abhishek Chinchalkar, an analyst at Mumbai-based AnandRathi Commodities Ltd., said in a report today.

READ

Goldcorp: We have hit PEAK gold
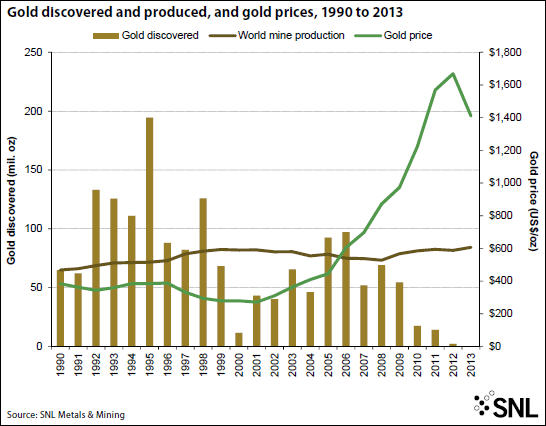
The CEO of the world's most valuable gold miner Goldcorp (TSE:G) says "peak gold" will be reached this year or in 2015.

Chuck Jeannes told the Wall Street Journal global gold production will start to decline "as easy-to-mine gold deposits become harder to find" and in the absence of any major technological breakthrough.

The amount of gold discovered and the number of major discoveries (defined as any deposit with a minimum of 2 million ounces of contained gold) have been trending downward over time, from 1.1 billion ounces in 124 deposits discovered during the 1990s to only 605 million ounces in 93 deposits discovered since 2000.


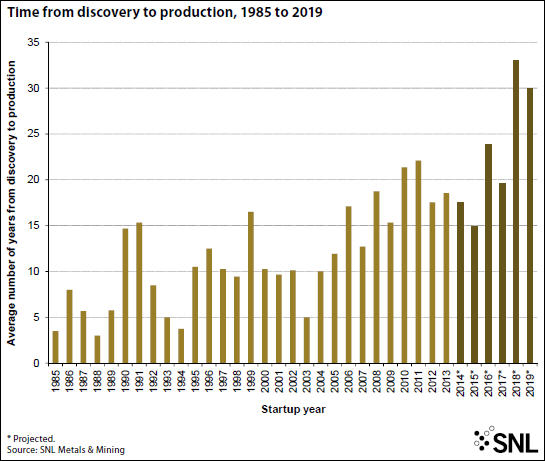
The time it takes to bring a deposit into production is also increasing significantly, slowing the rate at which production is replaced. Between 1985 and 1995, 27 mines with confirmed discovery dates began production an average of eight years from the time of discovery. The time from discovery to production increased to 11 years for 57 new mines between 1996 and 2005, and to 18 years for 111 new mines between 2006 and 2013.


READ

SEE ALSO

Investors, Speculators Leaving Gold Market In Droves
Precious metals investors poured money into the sector during July, but renewed selling in August only accelerated into September.

Global exchange traded funds backed by physical gold saw outflows last week of 13.4 tonnes, dropping total holdings to 1,713 tonnes, perilously close to four-year lows of 1,708 reached in June.

Some 17 tonnes left during August and that compares to inflows in July which was the best since November 2012. Year to date roughly 50 tonnes have left the dozens of funds traded around the globe and investment bank Barclays believes 100 tonnes could exit the market in 2014.

Gold ETFs saw outflows last week of 13.4 tonnes, dropping total holdings perilously close to four-year lows reached in June

Gold bullion holdings in global ETFs hit a record 2,632 tonnes or 93 million ounces in December 2012, but last year saw net redemptions of 800 tonnes.

READ

Yamana Temporarily Suspends Ramp-Up Activities At C1 Santa Luz
Yamana Gold will temporarily suspend ramp-up activities at its C1 Santa Luz mine, located in Brazil, and place it on care and maintenance. “The decision to temporarily suspend ramp-up activities at C1 Santa Luz and put it on care and maintenance is consistent with the company's focus on maximizing cash flow rather than production only and protects the significant inventory of mineral resources that that would otherwise likely be lost permanently to tailings with the current recovery levels,” Yamana says.

“In so doing, the potential future viability of the project is preserved as that inventory is profitably mined and recovered utilizing one of the metallurgical processes that will be implemented once the evaluation process is completed.”

The company says they will be evaluating the mine with an “alternative metallurgical recovery processes before end of 2015.

Yamana does not expect a large impact on its 2014 gold equivalent production guidance of 1.42 million ounces at all-in sustaining cash costs between $825 and $875.

READ


NON-MARKET NEWS

Scientists find mysterious species that defy all classifications of life

Science Explains Why Beer Is The Liquid That Fuels Civilization

The Start-to-Finish Guide to Securing Your Cloud Storage

Why China's Building a Military Base in the Middle of the Ocean

“Fists In the Mouth of the Beast”: On Irish Folklore

The 10 Most Underrated Jobs Of 2014

Wednesday, April 23, 2014

America Is Swimming in Oil -- 4 Charts

Just sit right back, and let me tell you a tale about a man named Uncle Sam. You see, Uncle Sam is swimming in oil.

Now that you're ready to rip your own eyes out, let me tell you that I have a lot of charts and data below. And the last chart is a doozy.

Bloomberg tells us ...

Shale Boom Sends U.S. Crude Supply to Highest Since 1930s
The U.S. is stockpiling the most crude since the Great Depression, thanks to the shale boom that has boosted production to the most in 26 years.
Inventories rose 3.52 million barrels last week to 397.7 million, the highest level since 1931, according to Energy Information Administration data.
So why are oil prices so high? One analyst says that they could be higher, if not for weak demand.
“Although the market may think U.S. commercial crude is bursting at the seams, it is not — and at 397.7 million barrels, we are only 2.3% higher than one year ago,” said Richard Hastings, macro strategist at Global Hunter Securities. “The problem is on the demand side, which is quite weak.”
In other words, we're producing a lot more oil. But it's not cheap oil.

Sean's note. It seems that refiners are processing plenty of it. In fact, refinery utilization was at 91% for the latest week, up from, 88.8% a week earlier and up from 83.5% the same time a year ago, EIA data showed.

So why then did this happen ...

Gasoline Trades Near Eight-Month High as Supplies Drop
Gasoline inventories decreased by 0.3 million barrels to 210.0 million barrels. At 210.0 million barrels, inventories are down 7.8 million barrels, or 3.6% lower than one year ago.
So what's the problem?  The EIA says seasonal issues have a lot to do with it.

Typical seasonal factors contribute to recent rise in gasoline price

The EIA says: "Changes in the price of retail gasoline result from changes in both the price of crude oil and wholesale gasoline crack spreads. Crude oil prices do not display a seasonal pattern. Crack spreads for gasoline, however, are very seasonal. This post-February increase is largely related to typical seasonal factors such as refinery maintenance, increasing demand from driving, and the switch to summer-grade gasoline, which is more costly to produce than winter-grade gasoline."

Yeah, nice try.  But the real reason is that refiners are selling more and more product overseas. We can pump enough oil to drown Godzilla, but it won't matter if that oil is refined and exported.

You see, the EIA also says:
US petroleum product exports increased in 2013
US petroleum product exports in 2013 averaged 3.5 million b/d, up 10% from levels in 2012, according to the US Energy Information Administration. In December 2013, US exports of petroleum products reached 4.3 million b/d, the first time to exceed 4 million b/d in a single month.
Exports of distillate fuels in 2013 increased 110,000 b/d over the previous year to 1.1 million b/d, according to EIA data. This was accompanied by a 160,000 b/d increase in distillate fuel production in 2013 as the result of cost-advantaged US crude oil and natural gas and near-record-high refinery runs.
Here's a chart I made of US oil exports using EIA data. It goes through January (the latest month available).

Wait there are two more things you need to know.

First, the oil boom in Texas is big and getting bigger. In fact ...

Texas expected to outproduce all but one of the OPEC nations this year
Benefiting from the booming Eagle Ford Shale and Permian Basin, Texas likely will best the oil output of every OPEC country but Saudi Arabia by year-end, says a top exploration official at ConocoPhillips, a key acreage holder in both of those oil-and-gas formations.
The Lone Star State is expected to end 2014 with 3.4 million barrels per day in oil output, which exceeds that of 11 of the dozen OPEC nations.

Second, all that oil has to travel around the country somehow, right?

With Keystone delayed, oil by rail in DC spotlight
The story says ...
Delivery of oil by train has rocketed as the Keystone XL pipeline has been delayed for four years. It’s important to note that’s far from the only reason the transportation method for oil has boomed, as it also coincides with a boom in production here in the U.S., notably from the Bakken Formation in North Dakota.
According to data from the Association of American Railroads, U.S. carloads of petroleum products have more than doubled since April 2010, the first time the State Department delayed Keystone approval.
Slo who are we going to sell all this oil to? You get one guess, and it better start with "China". China is becoming more and more dependent on Middle East oil, and yet is unwilling to spend to protect that oil.

 The U.S., meanwhile, has less and less reason to protect Middle East Oil. So what's the easy solution? China can buy more of its oil from good ol' Uncle Sam. Maybe he'll be able to afford a new barrel.

This is all stuff to keep in mind as America's oil production booms.

Monday, March 31, 2014

Pain and Gain at Your Gas Pump

Are you paying too much at the gas pump? Are you sure?

On Saturday, I posted four energy charts, three of which had to do with crude oil. Here are two more energy charts, from Bespoke Group, having to do with the price of gasoline ...

Yes, gasoline prices are going up ...


In fact gasoline prices are up 12% since November. However, gasoline prices ALWAYS rise this time of year. Going back to 2005, the average price of a gallon of gas has risen in the first quarter every year for an average gain of 15.4%, according to Bespoke's analysis.

Bespoke doesn't explain that it's what happens when the refineries make the switch from the winter to summer blend of gasoline. So, there's no voodoo involved.

As refineries switch to cleaner summer blends, inventories go down and prices go up. Gasoline inventories decreased by 5.1 million barrels to 217.2 million barrels in the most recent count. At 217.2 million barrels, inventories are down 4.0 million barrels, or 1.8% lower than one year ago. 

The interesting thing is comparing the daily change in the average price of a gallon of gas so far this year to the 'typical' annual pattern going back to 2005. 


In other words, you're feeling pain, but not as much as usual. And that's a gain for consumers.

So why did consumer sentiment fall in March? The Thomson Reuters/University of Michigan's final March reading on the overall index on consumer sentiment came in at 80, down from 81.6 the month before, and below consensus estimates.

And this is despite the fact that consumers are spending more money.

Bonddad, writing at XE.com, reports on Consumer spending
ICSC -1.5% w/w.  +1.7% YoY

Johnson Redbook +3.1% YoY

Steel production is up. Railroad transport is humming along. Money supply is increasing. So why are consumers feeling so down?

Tuesday, October 22, 2013

Look for a Hidden Boost in Consumer Spending

The nattering nabobs on Wall Street are worried about the piss-poor jobs number this morning, and I can see that. U.S. employers added fewer than expected workers in September, which was before the budget battle in Washington even happened.  However, this does not derail my bullish thesis.
I'll show you why in one chart ...

This chart shows gas prices over the past two years.  You can see that prices are falling sharply. Prices were an average $3.89 per gallon on October 15, 2012.  They're now at $3.35.

According to an ABC story from earlier this year -- when gas prices were going up -- Merrill Lynch estimates that every penny increase at the pump is equal to $1 billion in lost consumer spending. 

Therefore, falling gasoline prices boost consumer spending by the same amount. And lower gas prices are probably boosting the economy right now.

So, the 54-cent difference in gasoline prices should translate to an extra $54 billion for the economy.

What's more, the EIA says that gasoline prices should continue to decline for the rest of this year and into 2014.

Something to think about when the doom-meisters sound their calls of woe. 

I'll have some picks to ride this trend in the Thursday issue of InvestmentU.com.