Showing posts with label Brent. Show all posts

Tuesday, March 24, 2015

Oil Prices and Oil Storage: Why a Price Rally is Difficult

On Tuesday, I read a story titled "10 Charts That Point to an Oil Rebound." At first, I was willing to dismiss the story, especially because it contradicts itself from one paragraph to the next, saying: "The sudden downdraft in oil pricing was caused mainly by Saudi Arabia and the Gulf States" followed by "The U.S. shale boom has been the only real global source of recent supply growth."

Well, which is it?

Hint: He was right the second time. Sort of. Iraq is growing production a lot, too, and until recently, so was Canada. Still, the U.S. is by far top dog in oil production growth.

There's also an older chart from Rystad Energy that confuses oil production costs with oil development costs. And so on.

That's not to say everything in the article is wrong. Some decent points are made. But the bad points ruin the overall analysis.

However, this isn't the only article calling for a rebound -- even a big rebound -- in oil prices. (example 1, example 2) When we start to see a lot of opinion that is contrary to our own, we need to investigate it.

After all, they might be right, and we might wrong. 

First of all, we should separate U.S. crude oil prices from international crude oil prices (Brent, but also other oil benchmarks around the world).

It is true that the global oil glut is only about 1.5 to 2 million barrels per day. A calamity in any of the troubled oil producing nations (Venezuela, Iraq, Iran, Libya, Nigeria, etc) could remove the global glut.

How about the U.S. glut?

US crude oil stocks are soaring. 

The blue line is current stocks at Cushing; the gray zone is the five-year range. Obviously, stocks of crude oil in this country are soaring. Crude oil storage at Cushing, Oklahoma, are up 15 weeks in a row, and reached 54.4 million barrels on March 13, according to EIA's Weekly Petroleum Status Report. This volume (measured in barrels) is the highest on record.

Capacity utilization at Cushing is now 77%, a large increase from a recent low of 27% in October 2014.

But it's not the first time oil in storage has surged. In fact, Cushing reached 91% of capacity back in in March 2011.


There was less storage at the time, so the total number of barrels was lower.

So what happened to oil prices back in 2011? Let's look at a chart ...


(Updated chart)

In fact, 91% storage utilization did not immediately impact prices. Oil prices went up for nearly a month after storage peaked.
Then, however, starting on May 2nd, prices started rolling down the slippery slope. In the space of a few months, they fell by a third. Ouch.

So maybe the lesson here is that oil storage isn't the main driver of prices. Maybe -- or even probably -- the U.S. dollar and speculation are more important.

By the way, look at the bottom of that oil chart, and you can see that RSI, a momentum indicator, is improving. This is why many technical analysts are calling a bottom in the price of the U.S. oil benchmark, West Texas Intermediate crude oil.

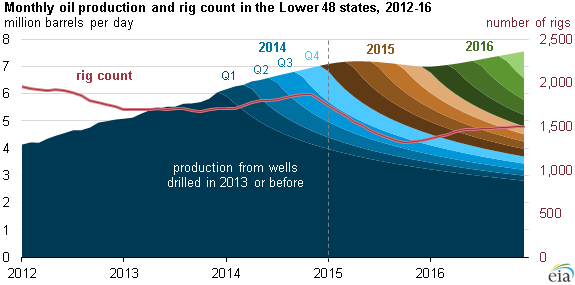
Meanwhile, there's the other factor in oil prices: The fact, that, even though the U.S. rig count has fallen for 14 weeks in a row, U.S. crude oil production keeps rising, recently hitting 9.42 million barrels per day.


(chart source)

In fact, production is still way up year over year.


You saw my previous chart on the US dollar and crude. Watch that one closely.

Finally, there's one more important thing we must take into consideration. And that's just how fast Cushing storage is filling up. And that's fast.


The EIA reports: "Cushing inventory levels in the previous two months have changed by about 2.2 million barrels (on a net basis). In previous years, the net weekly changes were more often in the range of 0.5 to 1.0 million barrels either in or out of Cushing."

So, IF storage is a part of the equation, then another big build this week would likely send oil prices lower.

But back to the point, "could oil prices rally and rally big?" Unless the U.S. dollar collapses or production starts falling/storage starts emptying, a real rally in U.S. oil prices is difficult.

New storage numbers come out tomorrow. We'll see. So, up or down? You can place your bets. Or maybe we're entering an "undulating plateau" of oil production.


Wednesday update: Crude Oil Inventories rose by 8.2 million barrels for the week, versus expectations of 5 million. That was down from the previous week's build of 9.6 million barrels, giving bulls a straw to grasp at.

Also, the build at Cushing was 1.9 million barrels -- below the average previous build (at least recently).


 Obviously, with Cushing near its limit, producers are looking to store elsewhere.

One more thing: When oil storage tanks are "full", they aren't full to the tippy-top. The company that builds those tanks says there's another 3% to 5% left at the top to prevent spillage. If that comes into play, that would be potentially more profit for the companies doing the storage, don't you think?

Wednesday, January 28, 2015

10 Crude Oil Links and Charts

Click on any of the headlines (except the first chart, which I made on Stockcharts.com) and it will bring you to a longer story.

1. A Monthly Chart of Brent Crude

(Updated chart)

2. Goldman Sachs sees WTI crude oil at close to $40 per barrel in first half
ONDON (Reuters) - Goldman Sachs said on Wednesday it expected prices for WTI crude oil to trade close to $40 (26 pounds) per barrel for most of the first half of 2015 in one of the lowest forecasts among major investment banks.
Goldman, one of the most active banks in commodities, said that after a very weak first half prices should recover to $65 per barrel for WTI and $70 for Brent.

3. U.S. oil well shut-ins start as crude rout batters small producers
As oil prices fell by more than half over the last six months from more than $100 per barrel, the U.S. oil industry responded by slowing its blistering growth and dialing back expansion plans.
Now, with U.S. crude around $46 a barrel, operators are already closing some small old wells, known as strippers, and tens of thousands of similar wells are on the verge of losing money. A further slide could, by some estimates, idle an equivalent of up to 2 percent of U.S. supply, slowing overall output growth more than expected or even leaving it flat.
There are about 400,000 stripper wells in the United States, most with operating costs of between $20 and $50 per barrel, according to analysts at Wood Mackenzie, a leading energy and commodities consultancy.
"At $40, we think you have got about 100,000 to 200,000 barrels per day at risk" from U.S. stripper wells, said RT Dukes of Wood Mackenzie.
Vast efficiency gains also mean that more oil can be squeezed from fewer new wells. For example, EOG Resources Inc said in November that output of new fracked wells in the Eagle Ford shale of Texas was up 39 percent compared with wells sunk at the start of 2014.

4. Fewer oil rigs does not mean less crude, EIA says
The sharp decline in oil prices has had a significant effect on U.S. drilling activity, the EIA said. Citing data from oil-field services company Baker Hughes Inc. BHI, the EIA said there has been a 16% decline in the number of active onshore drilling rigs in the continental U.S. from the end of October through last week.
In a January outlook, the EIA forecast Brent crude to average $58 a barrel this year and $75 a barrel in 2016, with New York-traded West Texas Intermediate forecast to be lower than Brent’s by between $3 and $4 a barrel during those years.
Discussing how fewer operating rigs don’t necessary mean less production, the EIA gave the example of North Dakota in the 2008 downturn. Permits and drilling activity fell at the time, but “production rates did not decline as substantially,” the EIA said.

5. Lower 48 oil production outlook stable despite expected near-term reduction in rig count
Should its price forecast be realized, EIA projects that the number of operating rigs will decrease by approximately 24% from January to October 2015 before beginning to rebound in November 2015. However, the outlook for Lower 48 production reflects more than just the rig count. Other key factors include the efficiency of drilling, which EIA tracks in its Drilling Productivity Report, the rate of decline in production from existing wells, and changes in the amount of time between the start of drilling (called spudding) and the completion of the well.

6. Falling crude prices will leave oilfield services companies ‘parked,’ may trigger layoffs
CALGARY – Depressed oil prices will cause many producers to drill, but not draw from, new wells, with the result that oilfield service companies will suffer from the drop in activity, the head of the Petroleum Services Association of Canada said Tuesday
PSAC is now predicting 7,650 new wells will be drilled in Canada this year, which would mark a 32% drop from the 11,226 wells drilled in 2014.

7. China to keep 200 MMbbl crude hoard even if oil rallies
BEIJING (Bloomberg) -- China is poised to maintain its commercial hoard of more than 200 MMbbl of crude within three years even if oil rallies toward $130/bbl.
In terms of capacity, China can store 307 MMbbl of commercial oil inventory as of last year, CNPC said in its annual research report also published on Jan. 28. Strategic oil storage tanks, spread over six bases nationwide, can take a further 141 MMbbl, the company said.

8. Cease Fire? The Energy Report 1/28/15
Is OPEC getting ready to declare a cease fire in the oil production wars? OPEC Secretary-General Abdullah al-Badri said that a bottom in oil may be near and high level rumors of meetings between OPEC and Non-OPEC members are creating speculation that there may be some type of agreement in the works to curtail production. Even Saudi Aramco said it would postpone some projects as it appears low oil prices are even making some Saudi expansion unprofitable. While there have been many denials the talk has been making the rounds and it offered oil some support aided by the weakened dollar. Yet with U.S. oil supply rising over 12 million barrels yesterday according to the American Petroleum Institute and rising Iraqi production it is unclear as to how they can structure a cut that will make a difference in the growing global oil glut.
Today is a key day for oil! If oil is going to have a chance to bottom it will have to surge off record U.S. supply and the Fed statement. While there is no press conference most believe the Fed will keep their thoughts behind closed doors and not change the statement. In the meantime traders will look at the Gasoline demand numbers as well as refinery runs to see if there is any changes that might signal  are close to a bottom. $44 is the line in the sand for West Texas Intermediate.

9. Oil Prices: What’s Behind the Drop? Simple Economics
United States domestic production has nearly doubled over the last six years, pushing out oil imports that need to find another home. Saudi, Nigerian and Algerian oil that once found a home in the United States is suddenly competing for Asian markets, and the producers are forced to drop prices.

On the demand side, the economies of Europe and developing countries are weakening and vehicles are becoming more energy-efficient. So demand for fuel is lagging a bit.

Households will likely spend $750 less on gas this year because of the oil prices, the United States Energy Information Administration said Tuesday. Europeans and consumers around the world will enjoy similar benefits.

Finally, #10, from January 20th ...
5 Reasons This Crude Move is Unbelievable
It’s been one amazing sell off in Crude Oil; so amazing we can’t stop writing about it. We’ve covered the long term picture of CrudeThe Best Tweets from Crude’s DropHow to Play a Bounce , andeveryone else’s  articles on crude. But we can’t stop staring at it… We’re the commodity focused moth to the proverbial flame.
But why is this sell off so amazing? What’s special about it?

Monday, January 26, 2015

Today's Must-See Chart #2: Brent Crude Oil

Here's a monthly chart of the international crude oil benchmark, $BRENT. You can see that it is coming down to support.

I realize the supply/demand picture for $Brent has changed since it tested support around $43 and $40 years ago. However, there are many technical analysts in the market.  We can expect buyers to come in and defend those levels.

And while there could be panic spikes to the downside, I think $40 is probably where $brent will base this year.  But we'll see.


Visit StockCharts.com to see more great charts.

The US oil benchmark, West Texas Intermediate, trades at a discount to Brent, but that is changing. And Canada's oil benchmark trades at an even deeper discount.

People are trying to call a bottom in crude oil right now. Most recently, OPEC General Secretary Abdullah al-Badri made vague comments that they "will see some rebound very soon", based on nothing but his own intuition, I guess. Also, he said oil prices could reach $200 per barrel if there's a lack of investment following this price slump. This reversed oil's earlier price decline, when it seemed to be drifting lower (again) after new Saudi regent, King Salman Bin Abdulaziz, pledged to maintain the old king's policies. Since those policies seem to be to pump as much oil as they want, those comments hurt oil.

So who's right?  al-Badri or Abdulaziz? 

I'm seeing lots of articles on oil; certainly "bottom" speculation is high. Some may say that such a media frenzy is itself a sign of a bottom. I'm not so sure. What we need to see is global supply go down and global demand go up. THEN we can start bottom-calling.