Showing posts with label energy. Show all posts

Thursday, April 30, 2015

Bullish Set-Up of the Day -- ONEOK Partners $OKS

Sometimes a stock doesn't fit my $10 Trigger Alert, and it's not time for a pick in my Oxford Resource Explorer. And yet it looks so tempting. One such stock would be ONEOK Partners, with its 7.5% yield.

A bullish break of the neckline on this inverse head-and-shoulders set-up would really get me interested, though.

Visit StockCharts.com to see more great charts.
(Updated chart)

Don't buy something just because some dude on the Internet likes it. Do your own due diligence.

Monday, December 22, 2014

Upcoming interview on Energy

On Wednesday, I'll be interviewed at 2 pm Eastern Time on Arise News (www.arise.tv), a cable news station in New York. In preparation, here are four stories I've written on energy recently.

“Three Pitfalls for Energy in 2015”


Nice Oil Cartel You Got There. Be a Shame if Something Happened to It

What Most People Don’t Get About Crude Oil

Wednesday, January 1, 2014

3 Must-See Charts & 14 Top Lists for New Year's Day 2014

It's New Year's Day. Time for a fresh start. Let's begin with important economic/market trends for the beginning of 2014 ...

1. The End of a 30-Year Cycle
For three decades, we've seen the US Federal Reserve lower the Fed Funds rate.  Unless the Fed can go below zero, that downtrend is over. How soon the next uptrend begins is anyone's guess, but you'd be wise to start preparing for the shift.

2. US reliance on foreign petroleum has fallen this year to a 27-year low of 34%


It's the shale revolution in one chart. Based on data recently released by the Energy Information Administration (EIA), US net petroleum imports have fallen to 34% this year through November, which is America’s lowest reliance on foreign sources of petroleum products since 1986, when imports supplied 33.4% of America’s petroleum

3. The Housing Market Rebound
Housing permits and starts continued to increase in 2013, rising to near 6 year highs in autumn. More good charts on economic trends HERE.

And now, on to lists you might find fun.

New Year's Day List-O-Mania

Here are 14 useful/interesting lists for the New Year. At least, I find them interesting. Your interest may vary.

1. The New Year's Resolutions Most Likely to Fail, and What to Do Instead
You know weight loss is on here, right? Click through anyway.

MOVIES

2. The 13 Best Movies of 2013 That No One Is Talking About
One of my favorite indie horror movies of 2013 -- an Irish film called "Grabbers" in which getting stinking drunk is the best defense against Lovecraftian space invaders -- is on this list. The rest look like they range from merely watchable to great.
3. 8 Top Horror Films of 2013
Strangely, they missed the frightmare called "Investing in Junior Miners." EEKS!

BOOKS I MIGHT LIKE

4. The Best SciFi Books of 2013 (Readers' Choice Nominees)
5. The Best SciFi Books of 2013 (Critic's Choice). Strangely little overlap. Or perhaps not so strange. I find that the system for choosing award winners in sci-fi has become deplorable.  There's a guy named Ken Lui who is winning all the awards and I find his writing to be syrupy pap clotted with obviousness; it's straight out of the Lifetime channel. Anyway, I have Amazon.com and B&N.com gift certificates burning a hole in my pocket; time to put 'em to use.

TECH

6. The 10 Best Technology Advances of 2013
Bionic eyes ... super-high-def ... lab-grown meat. We'll take your word on it for the last one
7. Seven Clever 7. Ways to Use Your Phone's Camera for More Than Just Photos
Text translation, record keeping, storing information from business cards (I already do that one myself)
8. 2013's Best Apps for IPad
Organized by category, including entertainment, news, photos, games, productivity and more.
9. 2013's Best Apps for iPhone
There is some overlap, but also cool apps you can only get on your phone.
10. 2013's Best Apps for the Mac
Again, some overlap, but some interesting differences.

BOARDGAMES/OTHER GEEKERY

11. The 10 Best Board Games of 2013
I've only played one of these. How is that possible?!
12. The Best New Boardgames of 2013.
Another list, this time, 11 games.
13. 25 Beers You Need to Drink in 2014
For then you will become a beer god!

OTHER
14. 55 Tax Breaks That Expired at Year's End
"It's a totally ridiculous way to run our tax system."

Monday, December 2, 2013

Gold, Energy, Charts and More for Monday

I'm flying to San Francisco this week, where I will be interviewing CEOs and other reps from a bunch of mining and energy companies. I'll post videos for my subscribers later in the week, so they can form their own opinions about these companies and what the CEOs have to say.

In the meantime, here are some things that have caught my eye.

Precious Metals

Thanks to the government crackdown on imports, Indian gold demand ahead of the Diwali festival season has been cut in half.

Holdings in gold-backed ETPs fell to 1,841.9 metric tonnes on Nov. 29, the lowest since March 2010, according to  Bloomberg data.

What's more, November saw $1.4 billion exiting gold-tracking ETFs, according to BlackRock. That brings the 2013 year-to-date outflow for the group to $36.4 billion. Gold ETFs around the world hold $74.1 billion, according to the same figures.

Speaking of November, spot gold showed a decrease of around 5.5% for the month. Gold hasn't dropped that much in November (which seasonally should be a bullish month) since 1978, according to data from the World Gold Council. In November 1978, gold fell 20%.

Historically speaking, gold has averaged a gain of 1.4% during November over the last 45 years, according to research by online gold exchange BullionVault and CNBC. Obviously, this time it's different.

You want some optimism? BMR points out that "what followed after that horrible November 1978, by the way, was an immediate climb that intensified throughout 1979 and eventually resulted in a quadrupling of the Gold price over a period of just 14 months"

Other Metals

China is expected to produce 770 million tons of steel this year, a record for the country.

Meanwhile, Mexican drug cartels ship iron ore to China, and China ships chemicals used to make methamphetamines to Mexican ports. Call it "Breaking Badder." Or "Breaking Malo." Hollywood, call me.

China

Not only is China getting grabby about airspace over flyspeck islands that no one lives on, it's also using ancient shipwrecks to lay claim to most if not all of the South China Sea. And who's going to tell them "no"? Too bad we spent all our treasure fighting endless wars in the Middle East, eh?

Energy

The United States will pass Saudi Arabia and Russia to become the world’s top oil producer in 2015, according to the International Energy Agency. Also, the IEA raised its forecast of global oil demand  to 101 million barrels per day (bpd) in 2035, up from 86.7 million bpd in 2011. That far out, those forecasts are Amazing Karnak-esque.

Meanwhile, OPEC expects overall demand for its crude to drop by about 300,000 barrels a day next year. Tensions are rising in the group over which members should trim back production. Couldn't happen to a nicer buncha people.

Global Economy

Morgan Stanley's Global Economics research team has a new note out looking ahead at 2014 titled Five Key Transitions.
In it, they identify five big themes that characterize what the regions of the globe are going through right now:


  1. US: From QE to credible forward guidance on interest rates.
  2. Japan: From deflation to (moderate) inflation.
  3. Europe: From financial fragmentation to a credible banking union.
  4. China: From leverage-driven growth to reform-driven growth.
  5. EM: From broken traditional to sustainable new growth models.

As MS sees it, the more these transitions are accomplished in 2014, the more likely we'll see robust global growth

Meanwhile, Bank of America Merrill Lynch has a chart showing that European equities have seen the longest streak of inflows in 11 years.

Finally, in the U.S. retail spending over Thanksgiving weekend dropped for the first time in at least seven years. Warning sign, or will Cyber-Monday (today) save retailers?Stay tuned.


Wednesday, November 20, 2013

Wednesday, October 23, 2013

Charts and Must-Reads on Gold, Oil & More

After rallying strongly yesterday, gold is down this morning. Is this the end of gold's brief rally?

Mother of mercy, is this the end of Rico?

I don't think so. The action in the Market Vectors Gold Miners ETF (GDX) seems balanced between bulls and bears, and this comes after quite a nice rally.  


(Updated chart)

The GDX still has a lot to prove. But we'll see. At this stage, I'd rather have bought last week -- which I did -- then be on the sidelines right now.  People with different risk profiles will view the situation differently.

I'm more concerned about the gap down in PTR, and REXX has dropped to support (?) at its 50-day moving average. And the SPDR S&P Oil & Gas Equipment & Services Index (XES) has gapped lower after gapping higher last week.


 (Updated chart)

Most of my energy positions remain in positive territory, and the money flow into the XES remains strong, but still, that chart action is worrisome. Weakness in crude oil is dragging down oil companies. [XX Note -- crude inventories rose more than expected for the fifth week in a row] I may take gains sooner rather than later.

On the other hand, natural gas looks like its downward momentum has stopped, and it may be ready for its next leg higher. So, let's leave it at "the energy market is in flux right now."

6 Good Reads for Wednesday

In the meantime, here is what I am reading ...

1. Art Cashin remembers the Crash of 1987: "The interaction with the futures saw prices melt away.  The Dow closed down 508 points.  One specialist, who made too good a market, ran out of funds and the firm was sold to Merrill Lynch that very night.  At watering hole after watering hole, traders and specialists reported again and again how strained their resources were.  Wall Street could not survive another day like this.  Luckily, innkeepers, like Harry let them put the drinks on a tab.

"What is often lost in the retelling is that the next day, Tuesday, was far more dangerous.  It was the day that the wheels almost did come off the locomotive."

Cashin added this important note:  “Keep An Eye On Gold – Our friend and colleague, Paul Richards, recalls that the last time we raised the debt ceiling, gold rallied 17% over the next 15 days.”

2. Excerpt from Eric Sprott's letter to the World Gold Council:

"For very different reasons, we are now at a similar pivotal point for gold. Over the past few years, we have seen incredible incremental demand from emerging markets. Indeed, so much so that the People’s Bank of China has announced that it is planning to increase the number of firms allowed to import and export gold and ease restrictions on individual buyers. In India, the government has been fighting a losing battle against gold imports by imposing import taxes and restrictions. Moreover, Non-Western Central Banks from around the world are replacing their U.S. dollar reserves by increasing their holdings of gold.

"But, demand statistics reported by the World Gold Council (WGC) consistently misrepresent reality, mostly with regard to demand from Asia.

... snip ...

Since ETFs have a finite size (about 1,900 tonnes left), these outflows cannot continue for much longer (see our article on the topic). All these observations point to a considerable imbalance between supply and demand (unless Western Central Banks decide to fill this void with what is left of their reserves).

3. Interestingly, money does grow on trees. Or at least, gold grows on trees. In Australia, mate!

4. Many are looking for Indian gold buying in November to boost gold prices. Considering that India's government continues its gold import restrictions, I don't see it. The biggest winners from the ban are gold smugglers, naturally.

5. ETFs are adding gold again. The SPDR Gold Trust (GLD), the world's largest exchange-traded gold fund added gold on Tuesday for the first time in a month, and by the largest volume in 8 weeks. It added 6.7 metric tonnes.

You know how important I think this is. The trust's assets remained near 56-months lows at 878 tonnes.

6. Quote for the day: "Anyone who averts his eyes from the hopeless lives many of our fellow citizens lead and tells himself and others that these men and women only have themselves to blame, is either a fool or a soulless bastard." 

Saturday, October 12, 2013

Oil Prices Trend Lower. But This Energy Fund Is A Winner (3 Charts) ...

I'm choosing today's energy winner for a few reasons, which I'll explain in a minute. 

First, the pick o' the day. The SPDR S&P Oil & Gas Equipment & Services ETF (XES) ...


(Updated chart)

As you can see, the XES is breaking out of its recent range. You could buy it with a stop at either the recent bottom of the range ($41.50) Or below the 50-day moving average OR below the recent uptrend if you have a stomach for risk and  big ol' brass ones.

Why I chose XES ...

1. Obviously, it's breaking out. My target is $62.

2. It's indicative of what's going on in the industry. Increasing oil demand is driving oilfield service activity. 
Source

3. It's an example of how select energy stocks and funds can do well even when oil prices go lower
(Updated chart)

In the short term, oil prices look to get weaker.  Sure, the bigger trend is up. If we get a test of support around $99, that's probably a great buying opportunity.

So why do energy stocks go up when oil goes down? While the price of oil is becoming more and more a reflection of global demand, there are still blockages getting oil out of Cushing, and prices could remain under pressure for a bit as American oil production continues to crank higher. Meanwhile, plenty of companies are VERY comfortable with oil in the $100+ range, and they want to pump more oil. So, the oilfield services companies are doing booming business.

Finally, oil services companies are being helped by the breakout in natural gas prices, which I talked about on Wednesday. We've seen follow-through as nat-gas moves to multi-month highs. This is sparking new interest in drilling for nat-gas and associated liquids.

I've seen multiple stories that the government shutdown is going to negatively impact the oil industry. So far, the action in oil industry stocks is calling those reports wrong. We'll see how it goes, though.

And remember, there are plenty of companies that do better when oil prices go lower.  Airlines (Spirit, US Airways, Delta), for one. Travel companies (Allegiant Travel) for another. Companies that use oil as an input -- for example, agricultural chemical companies like American Vanguard. 

Those are just some ideas.  In any case, these three charts show that while oil prices may be headed lower, select oil industry stocks and funds should head higher. 

I'm not your investment advisor. Do your own due diligence before buying anything.  And a smart investor would have a stop in mind -- and a profit target -- before buying anything.

Thursday, October 10, 2013

3 Smokin' Hot Energy Charts & More

I want to show you charts of three energy stocks, then I have a special surprise. Let's start with Devon Energy ...

(Updated chart)

Check out how Devon fell below its trend line in September.  It hugged it, and looked like it would break down. Nope.  Now, it's trying to get back above that trendline. If it does, a breakout that has been building up all year could be next. If it breaks out, the target is $79.

Devon trades near book value and 10.7 x forward p/e. EPS this year got hammered, which actually makes forward comparisons easier.  EPS next year is expected to rise 28.75%, if things go as expected.


(Updated chart)

Higher energy prices means more business for Parker Drilling. Parker trades near book value, 8.92x forward earnings and at just 0.97 times sales.  EPS this year is up 172.1%, and EPS next year should be up 66.15% (that's a guess, remember). Target on a breakout: $10.75


(Updated chart)

Along with breaking out of an obvious inverse-head-and-shoulders pattern, PetroChina is really cheap.  It trades at 8.78X forward earnings, 0.57X sales, and sports a PEG of 0.96.  Not a lot of earnings growth is expected -- 9.68% next year -- but it sports a 4.11% dividend yield, so you're paid to wait. Target: $148.50

Now, for the special surprise. If you've been reading the financial press, many analysts have been bearish on India.  But that just doesn't line up with this chart of the WisdomTree India Earnings ...


(Updated chart)

I could have used the iShares MSCI India Fund (INDA), but INDA has a lot less volume.  Anyway, the point is that India's market is not acting like the economy there is falling apart. It's acting like things are improving rapidly. It's true that India's trade deficit is improving, so that's good news (unless you're a gold merchant -- the main reason is because the government is stomping on gold imports). The breakout from the neckline of the inverse head-and-shoulders pattern gives us a target of $19.50. 

One last chart -- this is an update of the CEW, which I originally showed you on September 3rd, when I called it "One of the Easier Bullish Bets in a Pricey Market."


(Updated chart)

So, it's up 5% since I recommended it.  Not a huge gain, but considering how the broad markets acted during that time frame, I'll take it. CEW could go higher, but watch that overhead resistance, eh? Take profits, don't be greedy.

By the way, I could show you a bullish gold miner or two, but really, you have to start thinking beyond the miners.  When gold is down $10 on the day when the markets are ralllying big-time, the easiest path for gold in the short-term is lower.

The good news is that should bring us to a great buying opportunity. You know how people like gold for presents?  This year, it can be gold miners at a huge discount.

Anything I put here is for my own entertainment. I am not your investment advisor.  Do your own due diligence before buying anything, and beware of those "face-ripper" reversals of both markets and fortune.

Tuesday, August 27, 2013

The Secret Oil Shock

Remember how "drill, baby drill" was supposed to lower US gasoline prices? Whoever came up with that phrase has little understanding of how oil markets work.

It's true, US crude oil production increased to an average of 7.5 million barrels per day (bpd) in July, the highest monthly level of production since 1991.

Boom! US oil production blasts off.

On the right side of the chart, you can see how US production is shooting higher. That output is expected to jump to 8.2 million bpd by 2014.

This oil boom has had many benefits -- on corporate profits, and on the US balance of trade, for example.


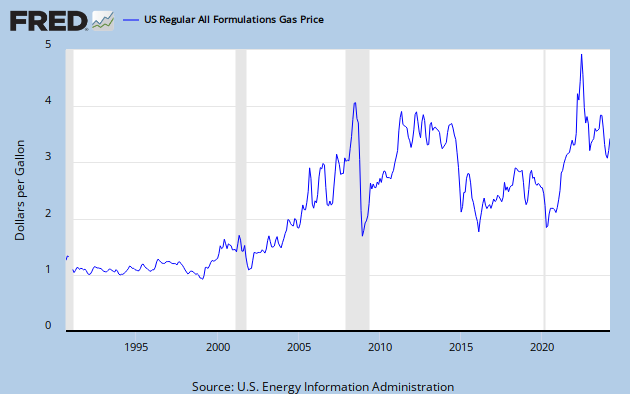
But even though American oil production is booming, prices at the wellhead and at the gasoline pump remain high for a number of reasons. The prices of oil and gas remain very elevated, far higher than at any time except for the end of the 1970's and in early 2008.

In fact, you could say we’re in the Third Oil Shock, though the mainstream media is not talking about it at all.

The price of U.S. gasoline recently dropped to an average $3.5586 per gallon. But the fact is, it’s been stuck around $3.60 for the past two years.  This is weighing on the economy. There is little doubt that we would be seeing a much stronger recovery if gas was priced at $1.60 or even $2.60 a gallon.


And now we have saber-rattling in the Middle East driving up oil prices again. You can bet this will translate to higher prices at the pump, at least in the near term.

So what's an average Joe investor to do?  Well, you can't do much about oil prices, but you can get even by investing in stocks that should do well as the price of oil stays high. And you can also avoid companies that will be hurt by high oil prices.

This gives us an interesting array of winners and losers. 

Winners:


Select energy companies. Specifically, I would look for companies that will benefit from booming US oil production. Enbridge Energy Partners (EEP) is an example. And it recently sported a fat 7.2% dividend yield to boot.


(Updated chart)

There are many more besides EEP. Magellan (MMP) is another. Do your own due diligence, and remember you're in charge of your own investing destiny.

Alternative energy vehicles. I'm talking about electric cars, and the push for cars that run on CNG (compressed natural gas). Also, trucks and buses that run on LNG (Liquified Natural Gas). Tesla (TSLA) is the best-known, but there are other, cheaper choices.

Traditional Auto Manufacturers. Because people trade in old gas guzzlers for more fuel efficient vehicles.

Railroads. The cheapest of the cargo transportation systems.
Any company that can cut down on travel expenses – remote conferencing, etc. 

Losers:


American consumers. Higher fuel prices both hit consumers in the pocketbook and constrain wages, because employers have to cut costs somewhere.

Some energy companies. For a number of reasons, E&P companies are sold when prices are high (basically, investors figure comparisons are going to suck going forward).

Brick-and-mortar retailers. People spend less money on junk when they have to spend more on gasoline. They also will shop online rather than drive to the mall. Have you noticed how we've seen big earnings misses from the likes of Gap Inc. (GAP), Abercrombie & Fitch (ANF), Staples (SPLS) and Dick's Sporting Goods (DKS).   Other companies that lowered earnings in just the past week include Bon-Ton Stores (BONT), Ross Stores (ROSS) and Anny Taylor (ANN). It's a brick-and-mortar retail massacre!

Good luck to us all, and good trades.

Sean