Showing posts with label gdx. Show all posts

Monday, April 20, 2015

Gold Miners Look Good Here ... Guess What Looks Better?

Here is a series of charts I am watching.

First, the US Dollar, as tracked by the PowerShares DB US Dollar Index Bullish Fund (UUP). Despite the fact that it is rallying today, it has fallen below its trendline of the last six months. Its rally seems to be stagnating.


And gold still can't get out of its own way. It is down today as well.

But take a look at the Market Vectors Gold Miners ETF (GDX).  You can see that miners are recovering nicely ...


We don't want to give this the "all-clear" yet because the metal isn't following ... yet. Now, miners usually lead the metal. So, it's likely that gold miners are putting in a bottom and the metal will follow. This seems more likely when you see that the miners seem to have put in a double bottom ...

(Updated chart)

I think that looks pretty bullish for miners. The metal should follow.

That said, there's something that's acting even more bullishly. And that's energy producers ...


(Updated chart)

Even though the Saudis have added enough extra production to equal HALF A BAKKEN per day, oil prices are recovering nicely and oil producers right along with it. That kind of action in the face of what should be bearish news is very bullish.

Just some things to keep in mind.

Monday, June 23, 2014

Gold and Miners Chart Teaser

Here's a teaser from the Investment University column I just turned in for this week. It's a percentage performance chart comparing, gold, the GDX and the GDXJ.

(Updated chart)


Thursday, June 19, 2014

Gold Miners Make Break-Out Attempt -- Chart

Here's a chart we should all be watching.


So why is this happening?

Well, gold bottomed anyway. You can see my post from last week about that ...

And as for the recent acceleration, well, we can thank Fed Chair Janet Yellen’s speech yesterday.

She said the central bank plans to keep its interest-rate target low for a considerable time after it ends bond-buying. That sent the Dollar Index to the lowest level this month. Since gold is priced in dollars, the two often move in opposite directions.

And here’s yesterday’s FOMC statement: “The Committee currently anticipates that, even after employment and inflation are near mandate-consistent levels, economic conditions may, for some time, warrant keeping the target federal funds rate below levels the Committee views as normal in the longer run." 

In other words, low rates FOREVER!

To be sure, gold could tuck its wings and swan-dive from here. This market is a mean bitch. But when you get on the right side of it, it can be darned profitable, too.

Monday, March 3, 2014

PDAC 2014 Gold Miner Update for Monday

I talked to a lot of great gold miners and developers yesterday at PDAC 2014 in Toronto. I also talked to a uranium company today. I expect more of the same today, along with base metals. Before I get to that, though, I wanted to take a quick look at gold and miners generally.

There seems to be a news-driven rally in gold right now.  Maybe it's because Russia is choosing a conflict with Ukraine over Crimea, as many believe.  I think it's more likely that the fact that China's manufacturing PMI slumped to a 3-month low is also shaking the markets, and leading many traders to believe that China is going to crank up the liquidity floodgates to keep its economy growing at a quick pace.

In any case, this is breaking gold out of the slump that it entered into last week, and pouring cold water on the broad stock market. Maybe gold miners will follow the broad market lower, maybe they'll follow gold higher. Here is a chart showing the overhead resistance for the Market Vectors Gold Miners (GDX), as well as support if it does continue to zig-zag lower ...
(Updated chart)

Looking at the chart, you could see the GDX was rolling over and probably headed for a test of one of those support levels. But the news over the weekend may have changed that, so keep an eye on overhead resistance.

Good luck out there today.  And if you're in Toronto, as I am, stay warm.

Friday, February 28, 2014

Gold and Miners Consolidate ... But for How Long

Here's a chart I sent to my Gold & Resource Trader subscribers today, part of a longer issue ...


(Updated chart)

You can make your own guess on how long this pullback lasts.

But I think that, if traders weren't taking profits going into the weekend, gold would be up today. 

We'll see what I find at the PDAC next week -- the opportunities could be extraordinary.

Wednesday, February 12, 2014

Gold Miners Are Back in a Bull Market

In a previous post, I told you how gold has to get above $1,327 to signal a new bull market. But gold miners aren't waiting. That's probably because the smart funds know leveraged miners trading at dirt-cheap prices when they see 'em.
(Updated chart)

Looking at the weekly chart, you can see that the Market Vectors Gold Miners fund (GDX) has broken its big downtrend. The ADX indicator on the bottom shows the bearish trend is over. The move is coming on nice volume, too, which I'm not showing on this chart because it's busy enough (maybe next time). 

The next target for the GDX is in green -- a nice move, and it could come quickly.

Let's take a look at a chart of the SPDR Gold Trust (GLD) while we're at it ...


(Updated chart)

I've added an indicator called the $BPGDM (Gold Miners Bullish Percentage Index). We need the BPGDM to rise above 30 for a confirmed bullish signal. It's not always perfect -- we got a false signal in July of last year. But combine that with the double bottom in gold and miners, and the positive shift in momentum, and I'd say gold's odds of getting back into a bull market are better than average.

Now imagine me saying that in a Crocodile Dundee voice after I throw a knife into a wall. There ya go.

Interestingly, this is coming as the US dollar index bounces from the bottom of its channel, as I predicted it would in a post earlier this week.


(Updated chart)

Since gold is priced in dollars, a bounce in the dollar, as seen tracked by the UUP here, SHOULD weigh on gold prices. That's not happening, at least not yet.

And the pullback in gold miners this morning was remarkably brief. A lot of hot money wants in, methinks.

The proof will be in the pudding. But the two new precious metals positions I recommended to Gold & Resource Trader subscribers last week are already racking up nice open gains. In fact ALL the Gold & Resource Trader recommended open gold and silver miner positions are showing nice open gains. I think there's more to come. Stay tuned.

Tuesday, January 21, 2014

3 Charts on Gold

Chart #1: Here is the technical take from Kitco News ...

From Kitco: "Physically backed ETPs rose by 7.4 tonnes on Friday (driven by SPDR), the first inflow in almost a month and the largest daily inflow since 31 January last year," according to Barclay's analysts.

Chart #2: Here is my technical take on the SPDR Gold Trust (GLD) ...

You can see that the easiest path for the GLD is to go higher. If it makes a 50% retracement, it will break the downtrend. It's anyone's game at that point. 

Chart #3: Gold Miners

Here is an analysis from @TradingView ...

According to this analysis, at the minimum, we should see a nice little rally from here. You can see the original chart HERE.

Good luck and good trades.

Thursday, October 31, 2013

Why I Exited Most of My Gold Positions Today

What a busy day -- I've had no time to update the blog.  But I sold a bunch of my precious metals positions at the open today. Here's why ...

Even though the Fed announced no change in its quantitative easing policy yesterday, gold sold off hard. That's a bad reaction to good news -- bearish.

The pain continued when the Wall Street Journal's Jon Hilsenrath -- aka The Mouth of Bernanke -- published an article saying that "taken together, the Fed
The Mouth of Bernanke strikes fear in markets
isn't taking a December adjustment o the bond-buying program off the table."


That caused the jittery bots on Wall Street to put on a hawkish trade. They sold gold bonds and stocks.  The Dollar Index rallied.

Too bad the bots didn't bother to read Hilsenrath's next sentence: "But that comes with the strong caveat that it depends on whether the economy is living up to expectations."

Interestingly, many gold miners rallied at the end of the day yesterday. So I was on the fence.  But thinking about it overnight, I decided that discretion was the better part of valor.

So, I exited ...


  • Silvercrest with a small loss (8.5%, but it was a half position, and cheap).
  • Global X Silver Miners flat. I gained 3 cents a share on the trade -- not enough to cover costs.
  • Market Vectors Junior Gold Miners at a 5.4% loss. Grr!
  • Market Vectors Gold Miners at a 1% gain.
  • B2Gold at a 2.5% gain on the combined position. I'd doubled up on that one. 
The only precious metals position I kept was Primero. Because I don't know which level of support GLD is going to test.


(Updated chart)

Maybe gold is going to head higher from its 20-day moving average (I can always buy more miners if it does). Or maybe it will go test support around 121.

I would look forward to that buying opportunity. 

I'll be more selective on miners operating in Mexico, because the Mexican Senate passed the new mining royalty law. As of January 2014, mining companies in Mexico will pay an additional 7.5% royalty on pre-tax profits and precious metals will pay 0.5% extra on top of that.

In any case, I strongly believe we saw the bottom in late June. 

That's when the selling by gold ETFS seemed to peak. Investors sold 750.2 tons through gold-backed exchange-traded products this year, erasing $60.1 billion from the value of the funds, according to Bloomberg data. Holdings reached 1,881.4 tons on Oct. 25, the lowest since April 2010.

In other news, the Chicago PMI blew out expectations, coming in much higher ...

Source

Here are the details. Two of the most impressive aspects of this month's Chicago PMI report were the big jumps in Production (+13.1) and New Orders (+15.4).

Will more news like that cause the Fed to hike rates?  I think the Fed is looking for more jobs. And the looming budget battle should cast a cloud over the economy. Once traders realize that, they'll come back to gold.

Elsewhere in the world, demand for gold is heating up.


Wednesday, October 30, 2013

Important Heads Up on China Gold Prices

I'm lifting this straight from Kitco ...
Gold on Shanghai Gold Exchange Wednesday traded below the international price in London for the fourth time within the last seven days, says Commerzbank. The discount reportedly amounted to $2 per ounce at times, the bank says. “By contrast, April and May were still seeing premiums of up to $30 being paid,” Commerzbank continues.
The bank says the discount lately is likely due to fears that lending regulations in China could be tightened, which is already being reflected in rising interest rates.
“The seven-day lending rate climbed significantly again today to 5.55% and has thus achieved its highest level in nearly four months,” Commerzbank says. “Interest rates are still a long way off their July high, however. Nonetheless, gold holdings were presumably sold as a result in order to generate liquidity. If this trend were to continue for any length of time, this could also lead to weaker Chinese gold imports.”

XX Sean's note -- this bears watching.

Another important point -- you have to understand that I am buying gold miners right now because of what I perceive as extraordinary value. And evidently I'm not alone, considering what the GDX has done since it bottomed on October 15-16 ...


(Updated chart)

So gold miners have done well. I'm buying them for value. But there are many investors buying them for performance.

Why is that important?  Because the S&P 500 looked like it had run into overhead resistance, so many performance chasers rotated out of the S&P 500 and into what was working (gold miners). But this has to be taken in the context of the fact that the S&P 500 has been on an incredible bull run. And now there are some very smart people saying that bull run could continue, with the S&P 500 going up perhaps another 5% into the end of the year.

If that happens, where will the performance chaser go? Back into the S&P 500, that's where.  And money would likely rotate out of miners.

That's just something to keep in mind.

That said, there's nothing wrong with buying the S&P 500 if you think it's going to go up. Heck, since the S&P 500 broke out to the upside on October 17, I've been waiting for a decent pullback to buy it, but we haven't gotten one ... yet.

These are all things to keep in mind as we watch gold and miners this week.

Wednesday, October 23, 2013

Charts and Must-Reads on Gold, Oil & More

After rallying strongly yesterday, gold is down this morning. Is this the end of gold's brief rally?

Mother of mercy, is this the end of Rico?

I don't think so. The action in the Market Vectors Gold Miners ETF (GDX) seems balanced between bulls and bears, and this comes after quite a nice rally.  


(Updated chart)

The GDX still has a lot to prove. But we'll see. At this stage, I'd rather have bought last week -- which I did -- then be on the sidelines right now.  People with different risk profiles will view the situation differently.

I'm more concerned about the gap down in PTR, and REXX has dropped to support (?) at its 50-day moving average. And the SPDR S&P Oil & Gas Equipment & Services Index (XES) has gapped lower after gapping higher last week.


 (Updated chart)

Most of my energy positions remain in positive territory, and the money flow into the XES remains strong, but still, that chart action is worrisome. Weakness in crude oil is dragging down oil companies. [XX Note -- crude inventories rose more than expected for the fifth week in a row] I may take gains sooner rather than later.

On the other hand, natural gas looks like its downward momentum has stopped, and it may be ready for its next leg higher. So, let's leave it at "the energy market is in flux right now."

6 Good Reads for Wednesday

In the meantime, here is what I am reading ...

1. Art Cashin remembers the Crash of 1987: "The interaction with the futures saw prices melt away.  The Dow closed down 508 points.  One specialist, who made too good a market, ran out of funds and the firm was sold to Merrill Lynch that very night.  At watering hole after watering hole, traders and specialists reported again and again how strained their resources were.  Wall Street could not survive another day like this.  Luckily, innkeepers, like Harry let them put the drinks on a tab.

"What is often lost in the retelling is that the next day, Tuesday, was far more dangerous.  It was the day that the wheels almost did come off the locomotive."

Cashin added this important note:  “Keep An Eye On Gold – Our friend and colleague, Paul Richards, recalls that the last time we raised the debt ceiling, gold rallied 17% over the next 15 days.”

2. Excerpt from Eric Sprott's letter to the World Gold Council:

"For very different reasons, we are now at a similar pivotal point for gold. Over the past few years, we have seen incredible incremental demand from emerging markets. Indeed, so much so that the People’s Bank of China has announced that it is planning to increase the number of firms allowed to import and export gold and ease restrictions on individual buyers. In India, the government has been fighting a losing battle against gold imports by imposing import taxes and restrictions. Moreover, Non-Western Central Banks from around the world are replacing their U.S. dollar reserves by increasing their holdings of gold.

"But, demand statistics reported by the World Gold Council (WGC) consistently misrepresent reality, mostly with regard to demand from Asia.

... snip ...

Since ETFs have a finite size (about 1,900 tonnes left), these outflows cannot continue for much longer (see our article on the topic). All these observations point to a considerable imbalance between supply and demand (unless Western Central Banks decide to fill this void with what is left of their reserves).

3. Interestingly, money does grow on trees. Or at least, gold grows on trees. In Australia, mate!

4. Many are looking for Indian gold buying in November to boost gold prices. Considering that India's government continues its gold import restrictions, I don't see it. The biggest winners from the ban are gold smugglers, naturally.

5. ETFs are adding gold again. The SPDR Gold Trust (GLD), the world's largest exchange-traded gold fund added gold on Tuesday for the first time in a month, and by the largest volume in 8 weeks. It added 6.7 metric tonnes.

You know how important I think this is. The trust's assets remained near 56-months lows at 878 tonnes.

6. Quote for the day: "Anyone who averts his eyes from the hopeless lives many of our fellow citizens lead and tells himself and others that these men and women only have themselves to blame, is either a fool or a soulless bastard." 

Thursday, October 17, 2013

2 Buys in Gold Today

Here are two stocks and funds I think were worth buying today. We'll use the prices indicated on the charts for tracking purposes ...


Bullish gaps in the GDX usually have follow-through, and MACD gives us a bullish cross-over for the first time since July.  You could put a price target at either the September high or the 200-day moving average, which is coming down, but let's say 31.25. The trailing, close-only stop would be at around 22.70.

So, there's 8% downside risk, and the 31.25 target gives us 26% upside. Half position only.

And for those daring enough for single-stock risk ...


B2 Gold is one of my favorite miners. It hasn't broken out yet, but its gap higher today to its downtrend raises the possibility of a follow-through.

B2Gold has great management, is a low-cost miner, has three operating mines in Nicuaragua and the Philippines, and plans to have a fourth mine coming online in 2015. Production is expected to grow from around 370,000 ounces of gold per year in 2013 to over 550,000 ounces of gold per year by 2015. The company also has money to burn, or at least enough to carry them through hard times. 

At at 1.5 million shares a day, this stock is very easy to trade in and out of. And also hard (or at least harder) to push around than some other small-caps.

 My initial price target is 3.40. The trailing, close-only stop is at around 2.20. That gives 44% upside, and 6% downside risk. Very acceptable.  Half position only.

If gold continues higher, I'll have more picks tomorrow.  But I really want to make more buys in energy, and I have a couple banks on my shopping list as well. Mañana.

I'm not your investment adviser, and you should be doing your own due diligence. What works for me may not work for you. Don't buy something just because some idiot on the Internet likes it.

That said, good luck and good trades, whatever you buy.

Friday, September 13, 2013

Friday Chartapalooza -- Gold, Dollar, and Anti-Gold

I'm preparing for my trip to Nevada, which starts on Saturday. I'm visiting 5 miners in 7 days, and I'll be driving all over the state. If you hear about some Florida hick who got jacked by a bunch of post-apocalyptic road warriors in the Nevada desert, that's probably me. Still, preparation is half the job, and so I'm making sure I have everything I need.

Also, I got a link from IncakolaNews -- and thank you very much for that. I mean, it's nice to get a link from an analyst I respect. So, I guess I better put up some charts. Here are some updated charts of gold, as well as some new charts of what you might want to be watching -- seven charts in all.

First, the biggie -- gold.  This is only updated through last night's close, because that's how Stockcharts.com rolls on commodities. Still, it's obvious that gold got hit with an ugly stick yesterday ...

You can see that gold was channeling higher, but it clearly broke down yesterday.  Next support is at 1275, but it's not especially strong support.  RSI, a measure of momentum on the bottom of the chart, has dropped below the 50 line, giving us a moderate "sell" signal.

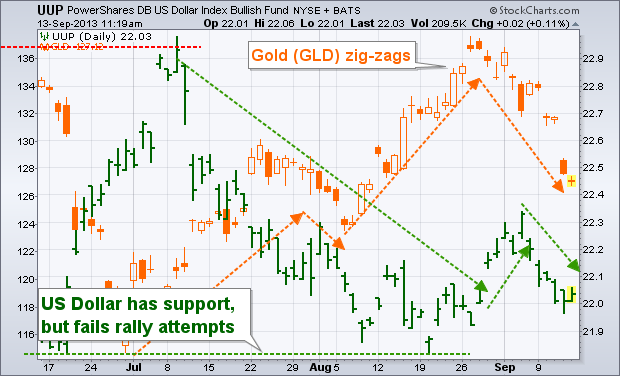
To say that gold is not following its usual plan in September -- usually one of its strongest months -- is an understatement. And this is happening while something else very curious is happening. I'm talking about the relationship between gold and the US dollar ...


Usually gold and the US dollar move in opposite directions. More recently, though, they are both moving kin the same direction -- down. This is a classic "risk-on" trade. In other words, credit less-apocalyptic news out of Syria, credit whatever you want, but investors are less scared, and so they are willing to take money out of "safe" investments like gold and the dollar, and put them in more "risky" investments.

But what could that be, you ask?  I'm so glad you asked ...


Just look at the Nasdaq Composite. It recently broke out of a range, and set a new high yesterday.  Add in the fact that the Nasdaq has rallied more than 17% in the past 5 months. 

So put yourself in the Gucci loafers of a momentum investor.  Ask yourself: Where do I want to invest? In go-go Nasdaq stocks or sad-sack gold miners?  If you're honest with yourself, you know what those momentum investors are saying.

That makes the Nasdaq the anti-gold. I'll show you another "anti-gold" in just a bit.

Now, does this mean I hate gold miners? No! I think there's extraordinary value in select mining stocks, and that value is going to become even better.

Considering that I just got word that my new Oxford Club resource newsletter isn't going to launch until late November, this is actually a good turn of events for me.  Heck, in the most selfish part of my dark little heart, I kinda hope that gold and miners sell off right until the day before my publication launches. That will only make select mining stocks even better bargains.

Why? Because the long-term fundamental forces in precious metals -- including rising mining costs, growing demand from the emerging middle class in Asia, and other forces -- are still in place. If anything, those forces will probably grow stronger, making these bargains even more incredible, as short-term sentiment drives weak hands to fold.

Now, speaking of the miners, let's look at an updated chart of the Market Vectors Gold Miners ETF (GDX), a basket of the biggest diggers in the industry.


Oh, this is painful.  You can see that the GDX has plainly fallen below support. And what used to be support now appears to be overhead resistance. We'll have to see how it closes out the day and the week (especially the week), but it looks like miners as a group have more work to do on the downside.

Where might that bottom be? Maybe the August low, maybe the June low.  Since the chart failed last time, let's wait for the gold miners to tell us where they want to bottom.

Now, let's look at how various groups are performing over the past two weeks ...


Dang, it's been a tough month for gold.  Bonds also suck wind, and the US dollar is dragging. Oil, despite its recent breakout, is still only average. The euro drifts along, barely positive. The big outperformer? Stocks, at least as measured by the SPY (S&P 500).

Over the past couple weeks, I've shown you other outperformers, including oil industry stocks and solar stocks.  Now, let's take a look at another "anti-gold" ...


You can see that Anheuser-Busch InBev (BUD) is trending higher.  It looks ready to tackle that August high. Bears tried to sell off the stock yesterday and couldn't budge it, even on high volume.

This is happening despite the fact that BUD disappointed on second-quarter earnings, with earnings per share of $0.93 versus estimates of $1.03.  Something's up with this stock.

Now, it could be the full-year outlook. Analysts expect BUD to earn $4.82 per share on revenue of $44 billion. This would represent a growth of 5.9% and 10.6%, respectively, compared to 2012. BUD is trading at just 12 times trailing earnings, 17 times forward earnings, and it even sports a 2% dividend yield.

A bet on BUD is a bullish bet on the U.S. economy. Sure, it's a global stock -- more than 200 brands of beers, and it holds the No. 1 or No. 2 market position in 19 countries. But it also holds more than 4% of the US market, and an improving US economy will boost BUD's sales.

Or maybe it's just all the miners crying in their beer, eh? 

There are other ways to play a rotation out of gold and the dollar and into stocks. This is just one of them. This is not an official recommendation; do your own due diligence, and do whatever is best for your own portfolio.

Other things I think look good right now are online jewelry seller Blue Nile (NILE) and October sugar.  NILE is a bet on falling gold prices -- all those sparkly gems are set in gold and silver, and as the price of precious metals fall, NILE's prices DO NOT go down, and its profit margins widen. I've made the case for brick-and-mortar jewelers in the past, and that worked out quite well.


Looking at a chart, you can see that NILE has traded in a range for months. However, it looks ready to test the top of that range, and potentially break out.  Meanwhile, the indicator on the bottom, NILE divided by the GLD, shows that as gold gets cheaper, NILE goes higher.  So if we expect gold weakness for at least the next few weeks, that could be a good time to be long NILE indeed.

Again, do your own due diligence. I'm not your investment advisor.

As for sugar, well, there are bunch of fundamentals on that one.  Not least of which is that India has had a great monsoon season, and the Indian government is putting its boot on the neck of gold sales, AND Indians are sugar-crazy (India is already the world's biggest sugar consumer).  If they can't buy gold, Indian farmers will probably indulge another way.  Just something to think about.

Meanwhile, on a per-capita basis, the U.S., Brazil, Argentina, Australia and Mexico consume more than double the world average of sugar.  So let's not go pointing fingers at people in India.

Could I show you more charts? Hell, yes. But I have a lot more work to do before I hit the road for Nevada.  So, take care and have a great weekend. My posting will probably be light next week, but I may have some video updates from the road as well. Stay tuned.

Wednesday, September 11, 2013

Updated Charts on Gold and Miners: Targets Dead Ahead

Today, we're taking another look at some charts I published on gold and miners.

First, let's look at an updated chart of gold, one that I originally published on August 31. At the time, I said gold was channeling higher, but it had hit resistance and was overbought. A test of the support zone between $1,325 and $1,350 seemed likely. And today ...


(Updated chart)

We are working our way down to that support zone ... but we may see lower prices yet. Be patient, and let's see where gold bottoms.  Don't try to tell it what to do.

Now, how about the Market Vectors Gold Miners ETF, the GDX? On September 4th, I talked about about its short-term bearish signals, and some support levels for this basket of big miners ...


(Updated chart)

You can see the GDX dropped to one of those support levels (the 50% retracement) yesterday. As I said back on the 4th, it would not surprise me to see it test the 25.60 area. But maybe support will hold at present levels. We'll see how it goes.

Considering that Indian official gold imports dropped 95% in August, this is actually some good strength in gold and miners. Though really, I expect the "unofficial" (smuggled) gold imports are off the charts. Yep, Indian and Nepalese "Han Solos" are making fortunes as gold smugglers

Just don't jettison the cargo, Han. You know that ticks Jabba off. He'll send Greedo after you.

And Bloomberg reports that Goldman Sachs says Fed Tapering will spur more gold selling. Considering that Goldman was saying "sell-sell-sell" gold in Q2, and then Goldman bought record amounts of gold in that quarter, I expect they'll do the same this time.

I mean really -- does Goldman Sachs think we can't remember what they did a couple months ago? Sheesh!

Meanwhile, Jesse has been all over the story of how Comex deliverable gold bullion is dropping to ludicrously low levels. What the heck is going on there, eh? It sure seems like those who own the gold refuse to sell it at the artificially low price the exchange has finagled.  I wonder how that will end.

As Jesse might say, "stand and deliver."

I find more interesting action in solar, oil, natural gas and other select natural resources and markets right now. But the big trend in gold and silver remains. Good luck, and good trades to us all.

Monday, September 9, 2013

Watch the GDXJ Junior Gold Miners Here -- Chart

I'm watching this chart of the GDXJ, a basket of junior gold miners ...


We saw gold and miners bungee-jump higher on Friday when jobs news disappointed and so investors ratcheted back their estimations of Fed tightening. Today, the GDXJ is outperforming both SIL (silver miners) and the GDX (large-cap gold miners). Still, it is in a no-man's land where it could break either way. And the tightening Bollinger bands are our clue that a breakout one way or the other is coming soon.


If it breaks to the downside, it could go back to support at $37. If it breaks to the upside, my target would be $62.  Momentum seems to favor the bulls. Watch for the break. Do your own due diligence -- this is not an official recommendation.