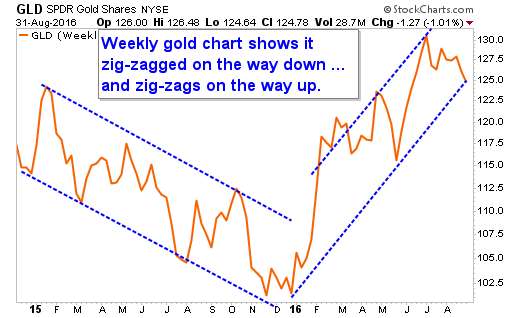
Wednesday, August 31, 2016
Saturday, August 27, 2016
Why Fischer Contradicted Yellen; Said We'll Have 2 Rate Hikes
Janet Yellen spoke on Friday. She didn't hint at a rate hike in September, gold and the markets soared.
Three hours later, Fed Vice Chair Stanley Fischer came out to say "What Chair Yellen really meant was ..." and completely contracted her.
I don't think it's about gold. I think it's about Treasury yields.
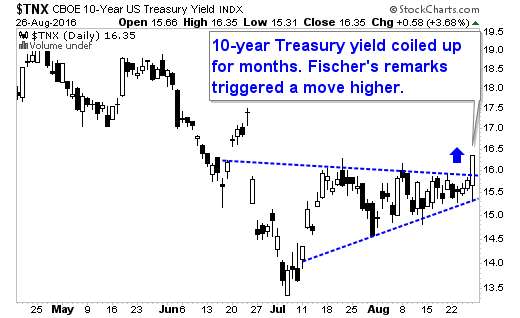
(Updated chart)
By the way, Fischer has a history of being full of baloney. The market doesn't remember, but last August he hinted strongly at a September rate hike and it never happened.
Where various Fed governors stand on rate hikes: LINK
Brad DeLong on what Fischer should have said. LINK
Three hours later, Fed Vice Chair Stanley Fischer came out to say "What Chair Yellen really meant was ..." and completely contracted her.
I don't think it's about gold. I think it's about Treasury yields.
(Updated chart)
By the way, Fischer has a history of being full of baloney. The market doesn't remember, but last August he hinted strongly at a September rate hike and it never happened.
Where various Fed governors stand on rate hikes: LINK
Brad DeLong on what Fischer should have said. LINK
Friday, August 26, 2016
Thursday, August 25, 2016
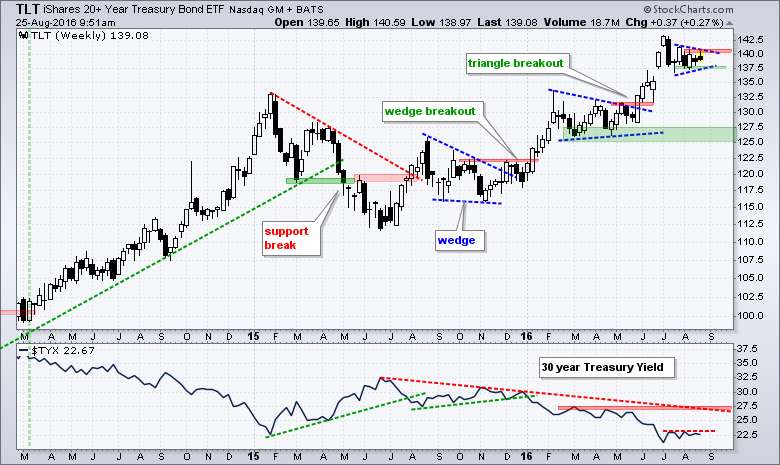
Chart of the Big Squee-ee-eeze in Treasuries ($TLT)
On StockCharts.com Arthur Hill offers a great chart of Treasury prices and yield.
(Updated chart)
And here is the link to Arthur Hill's original story, with a lot more charts
(Updated chart)
And here is the link to Arthur Hill's original story, with a lot more charts
Tuesday, August 23, 2016
Sunday, August 14, 2016
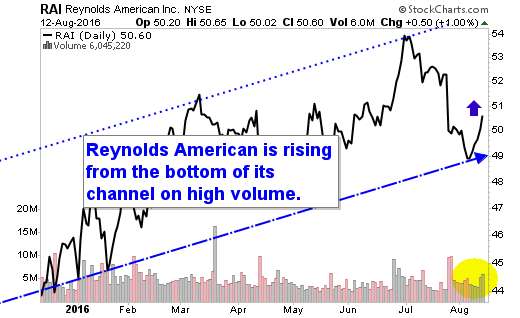
Reynolds American ($RAI) rises from bottom of channel
Just had to make this chart of Reynolds American for work; this is a good place to store it.
(Updated chart)
(Updated chart)
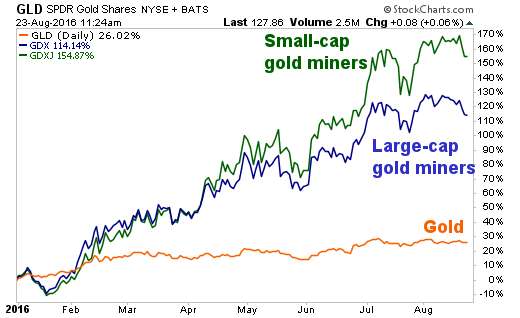
Gold and Silver Percentage Gains This Year
Just had to make this chart for work; I thought I would also share it with you.
(Updated chart)
You're welcome.
(Updated chart)
You're welcome.
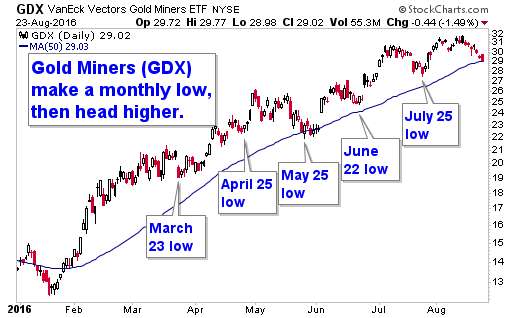
Gold Miners ($GDX) Chart Update
Just wanted to update this one from a few weeks ago.

(Updated chart)
Have a great rest of your Sunday. Monday crouches in the bushes like a panther, ready to spring upon us.

(Updated chart)
Have a great rest of your Sunday. Monday crouches in the bushes like a panther, ready to spring upon us.
Gold Poised for Deeper Pullback -- Get Ready to Buy!
On Monday, August 8th, I told Gold & Resource Profit Hunter subscribers to grab gains on half their Silver Wheaton calls. It was a nice gain. It was also well-time. Gold and silver went nowhere last week, and could go lower this week.
When I recommended grabbing the gains, the chart I showed Gold & Resource Profit Hunter subscribers was this one ...

(Updated chart)
Most people don't look at monthly charts. Most people are missing vital information.
On this monthly chart, you can see that gold has come up against its downtrend. At the same time, it hit overhead Fibonacci resistance. Fib levels are watched by many, many technical traders, and for that reason alone, they must be respected.
This is a one-two combo that has proved significant overhead resistance.
So how low could gold go?
The short-term (technical) levels of support are $1,309, $1,290 and $1,268.
If you are bearish, you will see these as steps on a path much lower.
If you are bullish -- and I am -- these mark potential buying opportunities. And not to be overly dramatic, but this could be the last great buying opportunity before gold really takes off.
As I said, I recommended subscribers grab gains on HALF their SLW calls. Those calls have plenty of time, and we're holding the rest for potentially bigger gains.
Likewise, we'll sit tight on the gold and silver miner stocks in the Gold & Resource Profit Hunter portfolio. All but the most recently added are up anyway. And this dip should be a bump in the road.
In fact, it may bring us to buying opportunities on other great companies.
I am making my shopping list now. You should be doing the same. We are still in the early stages of this great bull market.
Good luck to us all, and good trades.
When I recommended grabbing the gains, the chart I showed Gold & Resource Profit Hunter subscribers was this one ...
(Updated chart)
Most people don't look at monthly charts. Most people are missing vital information.
On this monthly chart, you can see that gold has come up against its downtrend. At the same time, it hit overhead Fibonacci resistance. Fib levels are watched by many, many technical traders, and for that reason alone, they must be respected.
This is a one-two combo that has proved significant overhead resistance.
So how low could gold go?
The short-term (technical) levels of support are $1,309, $1,290 and $1,268.
If you are bearish, you will see these as steps on a path much lower.
If you are bullish -- and I am -- these mark potential buying opportunities. And not to be overly dramatic, but this could be the last great buying opportunity before gold really takes off.
As I said, I recommended subscribers grab gains on HALF their SLW calls. Those calls have plenty of time, and we're holding the rest for potentially bigger gains.
Likewise, we'll sit tight on the gold and silver miner stocks in the Gold & Resource Profit Hunter portfolio. All but the most recently added are up anyway. And this dip should be a bump in the road.
In fact, it may bring us to buying opportunities on other great companies.
I am making my shopping list now. You should be doing the same. We are still in the early stages of this great bull market.
Good luck to us all, and good trades.
Subscribe to:
Posts (Atom)