Tuesday, April 29, 2014

4 Potential Crises for China

My piece for Thursday's InvestmentU.com is about China. It got too long, so I had to cut a chunk out. Here's what I removed:

The potential problem for China is if slowing economic growth triggers any or all of the four crises that are simmering just below the surface.

China’s 4 Potential Crises


  1. Migration. China has experienced three decades of migration that has left some of its cities bursting at the seams. China has eight cities as big as New York. New York has 8 million people. The "Big Apple" seems crowded, right? Well, Guangzhou has 13 million citizens; Beijing, 18 million; Shanghai: 23 million. This migration has strained local governments' capacity to provide adequate housing, health care and education. It’s also led to horrible levels of pollution. And migrants are treated like dirt, which leads to potential civil unrest.  Many of them have “temporary” jobs in construction. Speaking of which …
  2. What If China Stops Building? Chinese infrastructure investment has led to enormous gains in construction-related industries and employment, while boosting local gross domestic product. But the building boom can’t go on forever. And when it ends … or even slows down … that’s going to cause an employment crisis.
  3. The Conflict Between Landowners and Local Governments. Forced demolitions of private homes have sparked protests. Public outrage is heating up. In fact, the deputy party secretary of Sichuan was arrested on corruption charges. Sure, they’re all corrupt. He’s being singled out for his ruthless expropriation of farm properties.
  4. How to Pay for Social Services.  Local governments don’t have the authority to impose their own taxes in China. That’s why so many are neck-deep in real estate development; it’s how they generate much-needed revenue. If they are forced to cool down the red-hot real estate market, what will they do for money?

Unemployed or Underemployed? 10 tips to help you change that

My friend Dawn Pennington is filling an open slot on her editorial team.  Here's a list she made that is excellent advice for prospective job seekers. You'll see I have alternate advice for #4. But you might want to listen to Dawn -- she's the one hiring.

Things I’ve learned (or re-learned, or learned better) this month, being the person who can change your life or make you suffer ...

1. DO feel free check in with the hiring manager on occasion. They are busy and need help. They probably are meaning to call you but can’t find two seconds to rub together to do it.

2. DON’T call and hang up and call back and hang up. The hiring manager is probably on the other line and can’t hear what’s going on with you repeatedly beeping through.

3. DO e-mail. Busy people may not pick up their personal cellphones but they are probably watching their inbox from afar.

4. DON’T leave voicemail. Not in this day and age. We can see that you called.
XX Sean's alternative: Leave voice mail, but make it short and to the point. And speak CLEARLY. E-nun-ci-ate.

5. DO offer to send writing samples or otherwise provide additional information that will help them to reach a decision or to at least keep the conversation going.

6. DON’T tell us how great you are. And how much you need to be paid. And how much your student loans/mortgage/pets/kids/Grandma’s meds cost you. We genuinely don’t care. You are supposed to solve MY problems, not the other way around.

7. DO tell us how great of an asset you could be to us. I had a girl tell me “I couldn’t find your website” after I put the URL in the ad.  A GREAT candidate would have said, “Hey, you know what, your site doesn’t come up at the top of a Google search, but I could help you raise your page ranking with some keyword tricks I’ve learned.”

8. DON’T believe you’re God’s gift. God has many gifts to give. And I always keep my return receipts. And I am totally willing and eager to be surprised. But at least package yourself nicely and make me want to see what’s inside. Don’t CALL ME ALL WEEKEND and FIVE TIMES BEFORE 9 A.M. on MONDAY to beg me to tell you how awesome you are because you want an offer NOW NOW NOW.

9. DO play ball. Just don’t play hardball unless you’ve got some kickass experience and/or ideas for making/saving us money. We know you’re inflating your current salary. It’s OK. Just understand I am under no obligation to match or exceed it, but I am willing to reward someone who comes in and totally shines. But not a moment sooner, and certainly not before your start date.

10. DON’T slip off your mask too soon. If I ask you after a long day to meet one more person — a person who normally works from home that day who came in specifically to meet you — and you say thanks but I don’t have any questions for her and “you’ve kept me here a long time already” … well, foot meet door. Ask her how she likes working here and how much you would be working together, should you get an offer. Chances are I trust her and she can say something in your favor, if you give her the opportunity.

Monday, April 28, 2014

The Relationship Between Gold and The Dollar

I'm watching the U.S. dollar very closely here. Check out this chart from StockCharts.com for the PowerShares DB US Dollar Index Bullish Fund (UUP)

Visit StockCharts.com to see more great charts.

(Updated chart

You can see that the U.S. dollar drifts higher, then breaks lower, over and over again. Most recently, bullish action in the euro is weighing on the dollar.

Other thoughts ...
  • Since gold is priced in dollars, more weakness in the dollar should be supportive for gold. It's worrisome that gold hasn't done better considering the slump in the dollar. But maybe the price in New York has yet to catch up with the fundamentals.
  • And to be sure, all eyes are on the FOMC meeting this week.
  • Speaking of gold, the most recent news out of China can be seen as a positive. The latest figures from Hong Kong suggest that gold demand in China is yet again heading for a new record in 2014.
  • However, in India, farmers are concerned over a weak monsoon, which would drastically affect their crops. And that is probably dragging on gold.

Wednesday, April 23, 2014

2 Charts Showing Inflation Is Heating Up

Here are some charts I found interesting today. Let's start with Capacity Utilization.

Capacity utilization was 79.2% in March, which is a big increase from February.

Capacity utilization has been rising steadily since the economy bottomed in 2009. Over the past year, it has risen 120 basis points.

From 1972 to 2012, capacity utilization averaged 80.2%. It was highest in the early 1970s, peaking at around 89%. It bottomed at 66.9% in 2009.

This suggests there’s a lot of room for production to expand before we start feeling inflationary pressures. High capacity utilization levels in the 1970s were a big cause of inflation.

Speaking of inflation ...
After sliding for three years, commodity prices, measured by the Commodity Research Bureau Commodity Index, appear to have started to rebound [Figure 1]. Food prices are rising in part due to the extended effects of severe weather. And fuel prices have been rising — with gasoline prices at the pump jumping 45 cents over the past five months to a national average of $3.65 per gallon.

Other inflationary things to consider ...

  • The Consumer Price Index, the most commonly cited and used measure of inflation, averaged 1.4% over the past year, but rebounded from 1.1% in February to 1.5% in March.
  • The Producer Price Index, a measure of what companies are paying for inputs, increased 0.5% in March. It was up even more excluding food and energy (0.6%), accelerating 1.5% year over year.
  • Food prices are rising rather rapidly, jumping 1.1% in March. That was the largest increase since May of last year. Droughts in California and Brazil are lighting a fire under food costs. The top-10 fastest-rising food prices from January 2010 to March 2014 are: Bacon +53%, Ground Beef +35%, Oranges +35%, Coffee +31%, Peanut Butter +30%, Margarine +30%, Wine +25%, Turkey +24%, Chicken +22%, Grapefruit +22%

Mind you, overall inflation is still low. But it is starting to heat up.

America Is Swimming in Oil -- 4 Charts

Just sit right back, and let me tell you a tale about a man named Uncle Sam. You see, Uncle Sam is swimming in oil.

Now that you're ready to rip your own eyes out, let me tell you that I have a lot of charts and data below. And the last chart is a doozy.

Bloomberg tells us ...

Shale Boom Sends U.S. Crude Supply to Highest Since 1930s
The U.S. is stockpiling the most crude since the Great Depression, thanks to the shale boom that has boosted production to the most in 26 years.
Inventories rose 3.52 million barrels last week to 397.7 million, the highest level since 1931, according to Energy Information Administration data.
So why are oil prices so high? One analyst says that they could be higher, if not for weak demand.
“Although the market may think U.S. commercial crude is bursting at the seams, it is not — and at 397.7 million barrels, we are only 2.3% higher than one year ago,” said Richard Hastings, macro strategist at Global Hunter Securities. “The problem is on the demand side, which is quite weak.”
In other words, we're producing a lot more oil. But it's not cheap oil.

Sean's note. It seems that refiners are processing plenty of it. In fact, refinery utilization was at 91% for the latest week, up from, 88.8% a week earlier and up from 83.5% the same time a year ago, EIA data showed.

So why then did this happen ...

Gasoline Trades Near Eight-Month High as Supplies Drop
Gasoline inventories decreased by 0.3 million barrels to 210.0 million barrels. At 210.0 million barrels, inventories are down 7.8 million barrels, or 3.6% lower than one year ago.
So what's the problem?  The EIA says seasonal issues have a lot to do with it.

Typical seasonal factors contribute to recent rise in gasoline price

The EIA says: "Changes in the price of retail gasoline result from changes in both the price of crude oil and wholesale gasoline crack spreads. Crude oil prices do not display a seasonal pattern. Crack spreads for gasoline, however, are very seasonal. This post-February increase is largely related to typical seasonal factors such as refinery maintenance, increasing demand from driving, and the switch to summer-grade gasoline, which is more costly to produce than winter-grade gasoline."

Yeah, nice try.  But the real reason is that refiners are selling more and more product overseas. We can pump enough oil to drown Godzilla, but it won't matter if that oil is refined and exported.

You see, the EIA also says:
US petroleum product exports increased in 2013
US petroleum product exports in 2013 averaged 3.5 million b/d, up 10% from levels in 2012, according to the US Energy Information Administration. In December 2013, US exports of petroleum products reached 4.3 million b/d, the first time to exceed 4 million b/d in a single month.
Exports of distillate fuels in 2013 increased 110,000 b/d over the previous year to 1.1 million b/d, according to EIA data. This was accompanied by a 160,000 b/d increase in distillate fuel production in 2013 as the result of cost-advantaged US crude oil and natural gas and near-record-high refinery runs.
Here's a chart I made of US oil exports using EIA data. It goes through January (the latest month available).

Wait there are two more things you need to know.

First, the oil boom in Texas is big and getting bigger. In fact ...

Texas expected to outproduce all but one of the OPEC nations this year
Benefiting from the booming Eagle Ford Shale and Permian Basin, Texas likely will best the oil output of every OPEC country but Saudi Arabia by year-end, says a top exploration official at ConocoPhillips, a key acreage holder in both of those oil-and-gas formations.
The Lone Star State is expected to end 2014 with 3.4 million barrels per day in oil output, which exceeds that of 11 of the dozen OPEC nations.

Second, all that oil has to travel around the country somehow, right?

With Keystone delayed, oil by rail in DC spotlight
The story says ...
Delivery of oil by train has rocketed as the Keystone XL pipeline has been delayed for four years. It’s important to note that’s far from the only reason the transportation method for oil has boomed, as it also coincides with a boom in production here in the U.S., notably from the Bakken Formation in North Dakota.
According to data from the Association of American Railroads, U.S. carloads of petroleum products have more than doubled since April 2010, the first time the State Department delayed Keystone approval.
Slo who are we going to sell all this oil to? You get one guess, and it better start with "China". China is becoming more and more dependent on Middle East oil, and yet is unwilling to spend to protect that oil.

 The U.S., meanwhile, has less and less reason to protect Middle East Oil. So what's the easy solution? China can buy more of its oil from good ol' Uncle Sam. Maybe he'll be able to afford a new barrel.

This is all stuff to keep in mind as America's oil production booms.

Monday, April 21, 2014

And the Gold Miners I Follow Ended Up Today Because ...

We have some gold miners left in the Gold & Resource Trader recommended positions.  This itself is noteworthy because we were stopped out with gains on so many, and with losses on a couple.

Anyway, they went up today. Today, on a day when gold as tracked by the GLD did this ...

(Updated chart)

You can see that gold not only fell, it fell below its uptrend.

And yet my gold miners are up. Meanwhile, checking on the GDX and the GLDX, they are down, but both outperformed the GLD. In fact, they had the kind of reversals during today's action that points to higher prices tomorrow.

So why are miners outperforming gold today?  That's the million-dollar question.


Friday, April 18, 2014

6 Hot Stories & Charts on Gold & Silver

As we slide into a Good Friday weekend, I have some charts of gold and silver for you.

Let's start with two factoids from Frank Holmes at US Global ...

#1: China Continues to Accumulate Gold

China is now thought to hold 2,716 tonnes of gold, while the U.S. holds 8,812 tonnes. China would still need ten years for its gold holdings to catch up to the U.S., suggesting strong gold demand from China. With Russia on the offensive again, it too has the capacity to push oil prices higher, boost its revenue and purchase additional gold beyond domestic production.

XX Update -- thanks to sharp-eyed reader "Anonymous," I have corrected this figure.  US Global listed it as "million tonnes," and I didn't catch it. The World Gold Council lists more likely numbers. The chart is still wrong.


#2. India's Gold Trade Caught in Cash Bind.

India’s general election has negatively impacted gold trade in the country. Gold traders in India are used to cash transactions when buying and selling gold. With the election code of conduct in force, traders face severe restrictions on carrying physical cash in large denominations. According to Hasmukh Bafna, President of the Gold Chains & Jewellery Welfare Association, business has dropped by 70 to 80 percent since the first week in March.This low gold demand is expected to continue until the middle of May

#3. Russia Rising.

Russia has now overtaken the U.S. to become the world’s second-largest gold producer behind China. In fact, the Wall Street Journal reports that Russia's production of gold-containing concentrates increased in January-March by 12.3% compared with January-March 2013, and the country's gold output increased by 32.6% on the year.

#4. Silver Production at Primary Producers on a Slippery Slope

Steve at SRSRoccoReports.com says that for 2013, the top primary silver miners suffered the lowest average silver yield ever.

Read the rest of his analysis HERE.

#5. Gold Miner All-In Cost Blues

Deutsche Bank has released a chart showing all-in costs of some smaller gold producers.
Chart found HERE.

#6. Chart of Gold
Finally, here's an updated version of my gold chart.

(Updated chart)

 Clearly, this was a bearish week for the metal. Gold closed below $1,300 AND its 200-day moving average. A test of support seems likely.

I'm sorry if that's not bullish enough for you. If you want bullish, look at natural gas. I'll have more analysis on that next week.

Have a happy Good Friday and a Wonderful Easter.  By the way, do you wonder why it's called "Good" Friday. Wonder no more.

Peace be upon you.

Thursday, April 17, 2014

7 Must-Read Stories and Charts for Thursday

1. US export uncertainty unsettles global LNG industry
Where once 10 LNG projects worldwide were predicted to get sanctioned for construction in 2013, just one actually did, Yamal LNG in Russia.

A variety of forecasts agree more LNG plants are needed to meet global gas demand in the coming decade. A rough consensus is that 150 million metric tons of additional production -- about 20 billion cubic feet a day -- will be needed worldwide.

"Demand is rising strongly. There are many new markets. ...  As an industry, we are failing, year-on-year, to meet the targets we set ourselves," Houston told some 1,200 conference attendees from across the globe.

2. EIA: US natgas storage up 24 Bcf to 850 Bcf for week ended Apr 11. 
This is below expectations.  Natgas in storage is below a year ago and below the 5-year avearage. Year ago: 25 Bcf injection. 5 year avg: 37 Bcf build.


Note: It’s possible that late season heating demand is holding up better than expected.

3. The gold held by the SPDR Gold Shares ETF (GLD) has dropped below 800 metric tonnes again for the first time since February 12th. IKN has the chart ...

And from the GoldCore blog: Assets in the largest gold-backed exchange-traded product sank the most this year. New York's SPDR Gold Shares, reported outflows of 8.39 tonnes on Wednesday, the largest one day decline in its holdings since December 23. That has erased almost its entire inflow for the year, with its holdings currently at 798.4 tonnes, against 798.22 on December 31.

4. Is Putin’s Next Move to Take Over Odessa?
There are increasing signs that the unrest in eastern Ukraine is spreading, and Odessa, the country’s third-largest city, could be the next to fall.

5. Ukraine Currency Collapses Nearly 70% Against Gold In 4 Months
In Ukraine, the economy is nearing collapse and the currency is in free fall. The Hryvnia has been the world’s worst performing currency in 2014. This week alone the currency has fallen by 7% against gold.

"Once again, the lucky few who own physical gold are being protected from the currency collapse. They are in a position to buy food, water, property, land, businesses and other income generating and life sustaining essentials."

6. The 1% Wants to Ban Sleeping in Cars Because It Hurts Their 'Quality of Life’
Across the United States, many local governments are responding to skyrocketing levels of inequality and the now decades-long crisis of homelessness among the very poor ... by passing laws making it a crime to sleep in a parked car.

7. Fascinating Chart from Jesse's Cafe Americain ...


Tuesday, April 15, 2014

The US Dollar Is Confused

I'm posting an updated chart of my US dollar chart because today's rally has run out of steam. As has the rally in the broad stock market.

(Updated chart)

Interesting, eh? I wonder where it will go from here.

China Story on Gold Is Both Bearish & Bullish

Yesterday, Goldman Sachs reiterated its bearish, $1,050 target on gold. Then today, the Wall Street Journal published a very bearish piece on gold: "China Is Losing Its Taste for Gold"

I think the Wall Street Journal's story is the reason gold has dropped below $1,300 today. 

It's certainly not the Ukraine, where the situation is heating up. Sure, the US dollar is bouncing from support, and that generally weighs on gold (though it didn't yesterday, when both gold and the dollar went higher).

But the Wall Street Journal makes the bearish case very strongly.

China's appetite for gold is waning after a decade-long buying spree, suppressed by the country's economic slowdown and constrained credit markets.
Demand in the world's biggest gold consumer is likely to stay flat in 2014, according to estimates from the World Gold Council. Gold demand in China has expanded every year since 2002, when it declined, according to the industry group, whose forecasts are closely watched in the gold market.
"We're looking at best for it to be on par with 2013," said Albert Cheng, managing director for the Far East at the World Gold Council. The council is releasing its latest report on China's gold market Tuesday.
Although the report doesn't offer a figure for estimated Chinese gold demand this year, it says 2014 will be a year of consolidation. 
"Chinese consumers brought forward jewelry and bar purchases, which may limit growth in demand in 2014," the report said.
Mr. Cheng pegs China's private-sector gold consumption, a category that includes jewelry, bullion and industrial demand, to remain roughly at 2013's level of 1,187 metric tons.

There is a lot more to the story. But the clincher is these two paragraphs:

There was little activity visible on Monday at Chenghuang Jewelry, a store located just outside Yuyuan Gardens, a popular tourist attraction in Shanghai that is home to throngs of jewelry merchants. Sales associates stood around chatting, while a handful of customers perused wedding jewelry and gemstones. No customers were at the counter dedicated to gold-bar purchases.
"We're not seeing the kind of crazy buying we saw last year," said store manager Karone Huang. Last year, "we couldn't even fill our orders fast enough. That's how busy we were."

To be sure, the Wall Street Journal does have one bullish paragraph:
In the longer term, the World Gold Council estimates that China's appetite will rev up again. Chinese gold demand, excluding factory stockpiles, will increase 19% by 2017 to 1,350 metric tons, from 1,132 tons in 2013, according to the report. As China's economy continues to expand and citizens become more affluent, more of them will purchase gold jewelry or bullion for the first time.
Wait! Now for the Bulls!
Now here's where it gets interesting. Bloomberg took the exact same data and wrote this headline: "China Gold Demand Rising 25% by 2017 as Buyers Get Wealthier"
Gold demand in China, which overtook India as the largest user last year, will rise about 25 percent in the next four years as an increasing population gets wealthier, according to the World Gold Council.
Consumer demand will expand to at least 1,350 metric tons by 2017, the London-based council said in a report today. 
Bloomberg does cover the same ground as the Wall Street Journal story. But it devotes much less space to it:
Growth may be limited this year after 2013’s price decline spurred consumers to do more buying last year, it said. China accounted for about 28 percent of global usage last year, the council estimated in February.
Bloomberg goes on to add more bullish facts
By the end of 2013, about 1,000 tons of gold may be tied up in financing deals in China, in which commodities including copper are used as collateral for credit amid restrictions on lending, said the council. Most of the metal locked up in such deals have been built up since 2011, it said.
China has 170 cities that have at least 1 million inhabitants each, and the middle class will expand more than 60 percent to 500 million in the next six years, according to the report. About $7.5 trillion is held in bank accounts and household allocations to gold remain “small” at about $300 billion, it said.
China’s gold reserves total 1,054.1 tons, making it the fifth-biggest holder by country, according to the council. Bullion accounts for about 1.2 percent of its total reserves, compared with about 70 percent for the U.S. and Germany, the largest owners.
 China’s government lifted a ban on bullion trading and opened the Shanghai Gold Exchange in 2002. Huaan Asset Management Co. and Guotai Asset Management Co. won state approval last year to list the country’s first gold-backed exchange-traded products.
“We have witnessed astonishing increases in demand for gold from consumers across the country,” Cheng said. “The cultural affinity for gold runs deep in China and when this is combined with an increasingly affluent population and a supportive government, there is significant room for the market to grow even further.”
We can see that the Wall Street Journal emphasizes the short-term bearishness, while Bloomberg emphasizes the big picture story. Obviously, the street is focusing on the short-term bearishness.
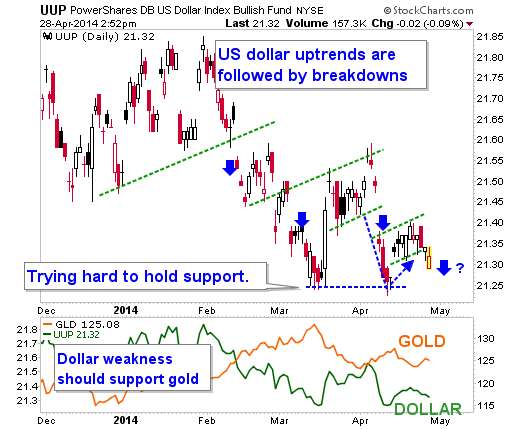
Speaking of short-term bearishness.  In Gold We Trust has a bearish chart in post titled "Weekly SGE Withdrawals Dropping, YTD 585 MT"
Here is the chart:

SGE withdrawals have been in a down trend for five weeks. In these weeks withdrawals have been lower than the year to date weekly average. This is not surprisingly after an unprecedented start of 2014. During four of the first seven weeks of this year SGE withdrawals, which equals Chinese demand, transcended global mining production. 
SGE withdrawals are still 23 % up compared to the same period last year. This will most certainly change in the period after April 15, which was the date in 2013 the gold price tumbled more than $100 and Chinese demand for physical gold exploded.
UPDATE: One more thing that spooked the market is a story in the Financial Times. I'm linking to the Barron's analysis of it because you can read that without a subscription.
FT reports on the surprising swift rise in the use of gold as collateral in financing deals, which may have reached 1,000 metric tons. No statistics are available on the outstanding amount of gold tied up in financial operations linked to shadow banking but Precious Metals Insights believes it is feasible that by the end of 2013 this could have reached a cumulative 1,000 tons, equal to a nominal value of nearly $40 billion.
Barron's adds:
To put the $40 billion figure in perspective, it’s equal in size to the heavy 2013 exchange-traded fund outflows when led the metal’s 28% price loss for the year.
So, my take from all this: Maybe the short-term story on gold and China HAS changed.  Interestingly, India is expected to lift its restrictions on gold imports very soon. And then we could see India retake the crown of global gold demand from China again.

Monday, April 14, 2014

Chart du Jour -- The S&P 500

I sent a version of this to my Gold & Resource Trader subscribers earlier today.

(Updated chart)

It bears watching.

Good luck and good trades.

Sunday, April 13, 2014

3 Important Charts on Gold

From Bullion Vault ...
GOLD DEMAND went up from 3,200 tonnes in 2003 to 4,400 tonnes in 2013,

Even with the steadily rising prices between 1999 and 2011 (going from $300 and ounce to $1900), gold discoveries plummeted in 1999 and remained on the floor thereafter:

Meanwhile in India ...


Here is the latest on India's gold imports.

In other news, could China start a gold-backed yuan

Gold and Silver ETPs Inflows

From Commodity Universe: 

Gold ETPs saw the strongest inflows of any commodity ETP besides silver in February and March, with inflows of $322mn and $536mn respectively. Large outflows in January ($946mn), however, meant that for the full quarter there were in fact $88mn of outflows. 

Silver saw the largest inflows of any commodity ETP group during the quarter, $354 net purchases, as investors looked to the metal as a leveraged play on improved sentiment towards gold. Silver was one of the few commodity ETPs to see inflows in every month of the first quarter, following on strong inflows in 2013.  It appears that investors view the silver price around the $20/oz level as a good entry point (less than half its 2011 peak) and with silver often viewed as a high beta version of gold, improved sentiment towards the gold price is causing investors to build positions in silver ETPs. 

Forbes has more details. And this could lead to more upside for gold.

Friday, April 11, 2014

Hot Links for Friday

I've been very productive this week.

At FreeMarketCafe.com, I wrote this story:

Who Will the Russian Bear Maul Next?

It's a follow-up to the piece I wrote last week ...

Russia's Newest Oil and Gas Project: Crimea

Meanwhile, at InvestmentU, I had the following story ...

It's Easier Than You Think to Cripple America

And we've also posted my recent conference presentation ...

Winners of the Nat-Gas Revolution

I also posted a subscribers-only Gold & Resource Trader issue on Friday with five red-hot charts and my market outlook. Here's one of those charts ...

And on Wednesday, I sent out my Oxford Resource Explorer Weekly Wire. That's for subscribers only, but it included this chart ...

Profit opportunities are brewing my friends. Have a great weekend.

Thursday, April 10, 2014

Food Inflation Is Here

On March 4, I published a story in FreeMarketCafe titled "The Inflation Drought Is Over." Specifically, I mentioned coming food inflation as a cause for higher prices. 

We only had to wait a month.

The headline in Reuters today: "U.S. import prices rise on surge in food costs"

The story: 
The Labor Department said on Thursday import prices increased 0.6 percent last month after an unrevised 0.9 percent rise in February.
Economists polled by Reuters had forecast import prices rising 0.2 percent in March.
Last month, import food prices jumped 3.7 percent, the biggest rise since March 2011, after falling 0.7 percent in February. Imported fuel prices rose 1.2 percent last month after advancing 5.3 percent in February.
Stay tuned.

Why Gold Is Higher Today -- China and Russia

Gold is up to $1,318 as I write this. What's behind the move? The general consensus is that minutes from the Federal Reserve's policy meeting suggested officials will be cautious on increasing interest rates. Certainly, the news sent the dollar lower -- and you'll remember my chart on the dollar from early yesterday morning.

But if the Fed news is the main driver of gold's move, why didn't gold take off yesterday, after the minutes came out?

The Fed may have something to do with it. But I believe the main answer lies in China.

China’s exports unexpectedly fell in March -- down 6.6% from a year earlier. Imports fell 11.3% at the same time.


Source

And remember, this is on the heels of a terrible month in February. China’s exports fell 18.1% in February from a year earlier, the biggest drop since the global financial crisis.

So obviously, China is in a slump. The question becomes, what will China do about it?

Premier Li Keqiang said the nation will roll out more policies to support growth while avoiding stronger stimulus.

But what many suspect is that the central government will slash the reserve requirement ratio (RRR) for banks, and tell them to start lending -- or else!

In other words, we could see a flood of liquidity come on to the market. And that could be tremendously bullish for commodity prices.

The Russian Part of The Equation

One more thing. The Russian central bank has changed its logo into a Golden Ruble, according to articles on Silver Doctors and In Gold We Trust.


Officials stated: Golden Badge of the Russian national currency, officially adopted by the Central Bank of Russia, will symbolize a sign of stability and security of the ruble gold reserves of the country.
Why did this happen? Part of the US response to the Russian takeover of Crimea is sanctions on Russian banks. This included Visa and Master Card refusing to conduct non-cash transactions through Russian credit cards.  It  worsening outlook on the banks and raised the potential of suspension of rating actions.

This ticked off the Russians the way cutting off anyone's credit cards would. 

So, on friday, Russia's Central Bank announced that it will only work in Russia, and only with rubles. Russia now set on creating a new national payment system (NPS) to replace Visa and MasterCard.

And it's brandishing gold as its symbol. That's a big F-U to the Western powers, and to the New York banking elite in particular.

Wednesday, April 9, 2014

3 Eyepopping Charts & Stories on Oil & NatGas


Story #1: Great chart in today's Wall Street Journal


By 2021, the U.S. may be one of the three largest LNG [liquefied natural gas] exporters in the world.

Story #2: Natgas Rises As Cool Spring Affects Supply

MDA Weather Services in Gaithersburg, Md., predicted colder-than-normal weather in the Midwest and parts of the eastern U.S. from April 12 through April 21. Inventories fell to 822 billion cubic feet in the week ended March 28, the least since 2003, government data show.

XX Sean's note -- just as I predicted in a presentation I made at the Oxford Club Conference in Carlsbad two weeks ago.

Story #3: the EIA reports that US natural gas consumption set a record this past winter.


US Dollar Is Breaking Down -- a Boost for Gold

Here's a chart of the US Dollar Index.

(Updated chart)

The US Dollar Index just had its biggest plunge in 6 months.At least part of this has to be due to the problems in Ukraine. As the US has slapped sanctions on Russian businessmen, Russia is trying to move away from the US dolllar.

This should be good for gold. At least, it has been in the past. Bullion is also getting a boost from news that Iran is going to buy more gold.

Tuesday, April 8, 2014

4 Charts for Tuesday Afternoon -- Earnings, Natural Gas, Gold

Chart #1: Analysts Cut Earnings Estimates for S&P 500

Alcoa (AA) kicked off earnings season after the close.  Earnings beat estimates, though it came in a bit light on revenues. Importantly, it says global demand for aluminum is solid.

Analysts have been hacking away at earnings estimates. More than usual. On the chart, you can see how earnings usually go after a quarter ends.

Chart #2: Earnings Volatility


This chart from Bespoke Investment Group shows how volatile stocks in different sectors are on earnings day. Utilities stocks move the least in reaction to their earnings reports, with an average one-day change of just +/-2.15%.  Financial stocks are the second least volatile at +/-3.61%.

The most volatile? Technology stocks are the most volatile around earnings, with an average one-day change of +/-7.14%.  Consumer Discretionary stocks are the second-most volatile at +/-6.18%.

Read the original Bespoke report HERE.

Chart #3: Half of Power Plant Capacity Additions in 2013 Came from Natural Gas
Natural gas-fired power plants accounted for just over 50% of new utility-scale generating capacity added in 2013. Solar provided nearly 22%, a jump up from less than 6% in 2012. Coal provided 11% and wind nearly 8%. Almost half of all capacity added in 2013 was located in California. In total, a little over 13,500 megawatts (MW) of new capacity was added in 2013, less than half the capacity added in 2012.

Read the whole EIA report HERE.

Chart #4: Gold Bounces
(Updated chart)

And here are the screaming fundamentals for owning gold (with more chartage).

Oh, and Wall Street considers this next batch The Most Important Charts in The World. Do you agree?

Monday, April 7, 2014

6 Hot Links and Charts for Monday

Here are some of the things I find interesting this morning.

1. India's gold imports rise in March
The gold import in India surged nearly 50 tones in March, amid the RBI’s import restrictions. Meantime, the RBI Governor, Mr. Raghuram Rajan hinted on the further relaxation of the gold import curbs today despite the increased gold import flow seen recently.

2. Former Treasury Official: The Fed Has No Integrity on Gold
Almost every week it is possible to illustrate the appearance of a large number of contracts shorting gold at times of day when trading is thin. The short-selling triggers stop-loss orders and margin calls and hammers down the gold price. The Fed has resorted to this practice in order to protect the value of the US dollar from Quantitative Easing.

In order for the Fed to effectively support the reserve status of the U.S. dollar by pushing it higher when it starts to drop, the Fed has also to prevent the price of gold from rising. Intervention in the gold market has been occurring for a long time. However, in the last several years the intervention has become blatant and desperate, as rising concerns about the dollar are causing countries such as China and Russia to accumulate fewer dollars and more gold.

Read the rest.

3. How much oil is produced in each tightoil play in the US?


4. Russia Makes New Move into Eastern Ukraine
Pro-Russia activists occupying a regional government building in Donetsk, in eastern Ukraine, on Monday proclaimed the creation of a separatist Donetsk republic, a Reuters witness said.

Sean's note: Read my column from last week explaining why the Russians would move into Eastern Ukraine. Hint: Oil, gas and coal.

5. The First 5 Things You Should Do When You Get a New Computer
Here are a few things you should do whenever you buy a new PC. Most people don't do 'em. Do you?

6. April 7 is National Beer Day!
Treat yourself. And have a great Monday.