Tuesday, April 26, 2016

4 Bullish Stories on Gold ... Barking Dragons, Islamic Law & More!

Here are my latest stories on the bullish case for metals AND miners.

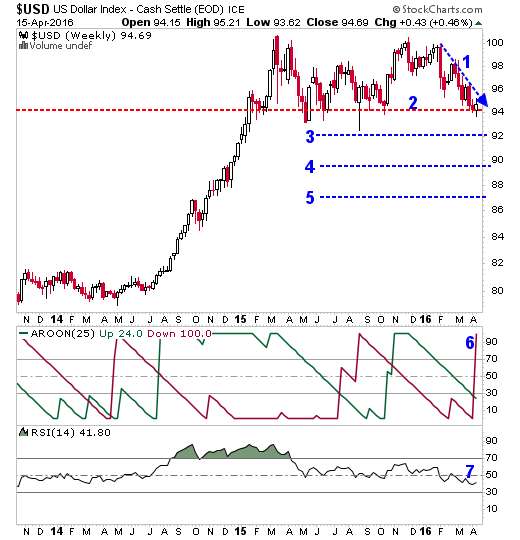
Dragons Are Barking for the U.S. Dollar … and that’s good news for gold.

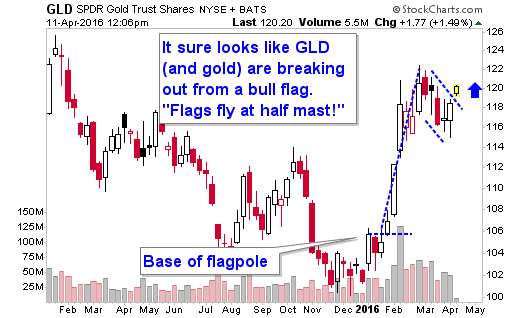
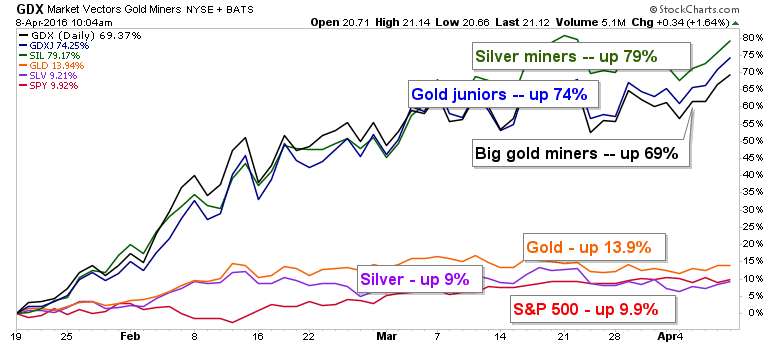
Yes, This Rally in Gold and Miners Is for Real … Asset Strategies International COO Rich Checkan sat down for an exclusive interview with me. He makes some great points for a precious metals rally. I’ve illustrated his points with two eye-popping charts.

Why Islamic Law Is About to Send Gold Prices Soaring … the mainstream media is asleep at the switch AGAIN, missing one of the biggest fundamental changes in the global gold markets.


China Is Hunting for Gold in Your Backyard … in my exclusive interview with Sprott U.S. Holdings CEO Rick Rule, he explains why the Chinese are buying up the best miners at hefty premiums.

Sunday, April 17, 2016

US Dollar Ready to Plunge ... and Send Gold Higher

This chart is for technical analysts only. If you believe technical analysis is bullshit, go read something else.

A weekly chart of the US Dollar Index shows it is in real trouble. Get a gander of the chart, then I'll explain.

Visit StockCharts.com to see more great charts.
(Updated chart)

1. The recent decline in the U.S. dollar. Any fool can see that. But that decline brings the green back to ...
2. Important support. The dollar index is at multi-month lows. This must hold. If it doesn't ...
3. First Fibonacci support.
4. Second Fibonacci support.
5. Third Fibonacci support.
6. Weekly Aroon trend indicator just gave a powerful sell signal.  Most of you are unfamiliar with Aroon, though, so ...
7. Momentum, as measured by weekly RSI, is definitely weakening.

If you want fundamentals that might prompt a move below support, here are some things I am watching.

Saudi Arabia threatens to sell off U.S. assets if Congress passes a bill that would allow the Saudi government to be held responsible for any role in the September 11 attacks. (link)

That's up to $750 billion in U.S. assets. Including lots of Treasuries. Foreign ownership of U.S. Treasuries is one of the things supporting the U.S. dollar.

And the Saudis have reason to be worried. 60 Minutes just did a segment on Saudi involvement in 9/11.

Estimates of U.S. GDP Growth Are in The Tank. The Atlanta Fed GDPNow model forecast for real GDP growth (seasonally adjusted annual rate) in the first quarter of 2016 is 0.3% on April 13. ZERO POINT THREE PERCENT!


Sure, first-quarter GDP was weak last year, too. But 0.3%. Great googly-moogly! That is awful.

Maybe things will pick up in the second quarter. Sure. As the oil patch collapses in on itself, keep telling yourself that.

The point is, with economic growth this weak, I don't see how the Fed can raise interest rates. The Fed recently cut its number of intended hikes this year from four to two. How does NONE sound to you? Sounds about right to me. And maybe the market is getting a whiff of that, too.

Economic Indicators are Weakening. Monthly data for March featured a big decrease in industrial production and capacity utilization.  Retail sales also fell, with a slump in vehicle sales getting most of the blame. Producer prices decreased.

I'm not saying we're going into recession. I'm saying this is more evidence the Fed can't raise rates. That cuts more support out from underneath the dollar.

So what does this have to do with gold? Easy. Gold is priced in dollars. Usually, when the dollar moves in one direction, gold moves in another. It's what I call the "seesaw of pain." 

For 4 1/2-years, gold was on the painful end of that see-saw. Now, that see-saw may be about to come slamming down on the dollar's head.

Monday, April 11, 2016

Gold Breaks Out from Bull Flag

Gold breaks out from its bull flag. Here's a weekly chart. I think it's going to run to between $1,450 and $1,500.

Visit StockCharts.com to see more great charts.
(Updated chart)

So how do you play this?

You could play it with the SPDR Gold Trust Shares. But I wouldn't.


You could play it with a leveraged gold fund. That's an interesting idea.


You could play it with a fund of large-cap gold miners (GDX) or smaller-cap, junior miners (GDXJ).  Those ideas are getting better and better. That's because miners are leveraged to gold.


But you also might consider the Global X Silver Miners (NYSE: SIL). Here is a daily chart.

(Updated chart)

I'm not your investment adviser. Do your own due diligence before you buy anything. Buying something without doing research just because some guy on the Internet talks about it is not a sound investment strategy.


Friday, April 8, 2016

Silver & Gold Miners Crush the S&P 500. I'm So Excited

Here is a chart from my presentation on precious metals at the upcoming Investment U conference in Carlsbad, California.

Visit StockCharts.com to see more great charts.
Updated chart

I got plenty more charts where that came from, buckaroo.

Are you excited? 'Cause I'm so excited, I should go on tour with the Pointer Sisters.

Tuesday, April 5, 2016

IMF: 'Dangers to World Economy Are Rising': Here's How to Play It

This post has to go work elsewhere. Duty calls.
In lieu of a piece about the IMF, I offer you the music of Trombone Shorty.

Friday, April 1, 2016

GLD takes a bearish turn

Our first clue that gold was in trouble was the weak, low-volume rally after Fed Chair Janet Yellen basically opened the sluice gates on free-money this week.

When that's the best that gold can rally under those circumstances, it's in trouble. Here's a chart of the SPDR Gold Trust Shares (GLD).

Visit StockCharts.com to see more great charts.
(Updated chart)

Sure enough, we are seeing real follow-through now. 

The bulls will point out that gold is touching its 50-day moving average, which could be support. That may be. However ...
  • RSI is falling again after trying to find support. That's bearish.
  • Aroon just gave a bearish signal.

It would not surprise me to see the GLD test first Fibonacci support at 113.97 (roughly 114, draw it with a thick crayon). I have marked that line (1) on the chart. That lines up with a peak from last October, which is now support.

That might hold. 

If it doesn't, then GLD could test a 61.8% Fibonacci retracement at 108.78. I have marked that line (2) on the chart. That is close to the 200-day moving average as well. And that would be a 6% decline from the recent price.

The 50% retracement offers no support that I can see. So, it's 38% or 61%.

We'll have to see how this plays out. Demand from China, India and ETFs will be crucial. Statements from various Fed governors will probably only confuse the situation (and traders).

Recently, investors have used gold ETFs to load up on gold despite gold's bumpy moves. It will be interesting to see if investors view this pullback as a buying opportunity. 

Good luck out there. And have a great weekend.