Friday, January 30, 2015

S&P 500 is Range-bound for Now ... But Coiling Up

You can see that the S&P 500 is both range-bound and coiling up within that range. Watch for the coming breakout. 

Visit StockCharts.com to see more great charts.

(link)

Which way do you think the market will break out? In today's $10 Trigger Alert, I'll tell subscribers my view.

Some stories you should read

Weekly Initial Unemployment Claims decreased to 265,000

This is the lowest level for initial claims since April 15, 2000 when it was 259,000.

Final January Consumer Sentiment at 98.1
That's up from 93.6 in December.
I'm sure this is somehow bad news for President Obama/Hillary Clinton/Insert politician of your choice, he said sarcastically.

Real GDP increased at 2.6% Annualized Rate in Q4
was below expectations of a 3.2% increase. However, Personal consumption expenditures (PCE) increased at a 4.3% annualized rate. That is the fastest pace in 9 years.


Thursday, January 29, 2015

$HES Breakdown Gives Us a Target

I wrote a piece for InvestmentU.com today in which I explained my reasoning why I think West Texas Intermediate Crude Oil (the U.S. benchmark) will remain below $50 for the rest of the year. I could be wrong -- especially if the US dollar goes bananas -- but this is how I see things.

That doesn't mean there won't be buying opportunities before the end of the year.  In fact, my colleague Dave Fessler talked about one such stock in his column last week. "Why 2014’s Worst Performer Could Be 2015’s Biggest Sleeper Play"

To be sure, Dave is more bullish on oil than I am.  But that doesn't mean I don't think we'll see bargains worth buying this year. On the contrary, once select stocks get beaten down far enough, they'll be excellent buys.

One stock Dave said he liked was Hess Corporation (NYSE: HES). You can read his reason why HERE. And Dave said: 
The company had a production target of between 92,000 and 97,000 barrels of oil equivalent per day from the Bakken by the end of this past December.
I expect them to meet or possibly even exceed that number when earnings are announced on January 28.
Well, Hess announced earnings and production all right. And sure enough, Dave was right about Bakken production beating expectations. 

In fact, Hess'  Bakken output came in at 102K barrels of oil equivalent (boe)/day. That represents a ~50% year over year increase.

What's more, HES expects overall FY 2015 production to average ~350K barrels of oil equivalent per day, up ~10% year over year.

So, should you buy Hess now? I don't think so. The energy sector as a whole and oil producers in particular have some more downside work to do. 

The good news is, the end is in sight.  I just did some technical analysis of a Hess chart, and here's what it shows ...

Visit StockCharts.com to see more great charts.

(Updated chart)

What we see in this chart is a breakdown from a classic symmetrical triangle pattern. This breakdown gives us a target of $54. Hess doesn't have to stop at $54, of course. But I don't think we're that far from an oil bottom -- I just think that prices will flatten out for much of the year. 

If I'm right, once prices stop going down, bargain-hunters will come into the sector. And I think Hess is one of the stocks they'll start sniffing at.

Now, what can you play in the meantime? Well, I've got all sorts of ideas I'm sharing with Oxford Resource Explorer and $10 Trigger Alert subscribers. There is plenty of money to be made in energy in this market -- on stocks of companies that do well when energy prices go down.

You just have to be willing to think outside the box.

Keep your eye on Hess ... keep your eye on $54 ... and keep your eye on global supply and demand.

Good luck and good trades.

Wednesday, January 28, 2015

10 Crude Oil Links and Charts

Click on any of the headlines (except the first chart, which I made on Stockcharts.com) and it will bring you to a longer story.

1. A Monthly Chart of Brent Crude

(Updated chart)

2. Goldman Sachs sees WTI crude oil at close to $40 per barrel in first half
ONDON (Reuters) - Goldman Sachs said on Wednesday it expected prices for WTI crude oil to trade close to $40 (26 pounds) per barrel for most of the first half of 2015 in one of the lowest forecasts among major investment banks.
Goldman, one of the most active banks in commodities, said that after a very weak first half prices should recover to $65 per barrel for WTI and $70 for Brent.

3. U.S. oil well shut-ins start as crude rout batters small producers
As oil prices fell by more than half over the last six months from more than $100 per barrel, the U.S. oil industry responded by slowing its blistering growth and dialing back expansion plans.
Now, with U.S. crude around $46 a barrel, operators are already closing some small old wells, known as strippers, and tens of thousands of similar wells are on the verge of losing money. A further slide could, by some estimates, idle an equivalent of up to 2 percent of U.S. supply, slowing overall output growth more than expected or even leaving it flat.
There are about 400,000 stripper wells in the United States, most with operating costs of between $20 and $50 per barrel, according to analysts at Wood Mackenzie, a leading energy and commodities consultancy.
"At $40, we think you have got about 100,000 to 200,000 barrels per day at risk" from U.S. stripper wells, said RT Dukes of Wood Mackenzie.
Vast efficiency gains also mean that more oil can be squeezed from fewer new wells. For example, EOG Resources Inc said in November that output of new fracked wells in the Eagle Ford shale of Texas was up 39 percent compared with wells sunk at the start of 2014.

4. Fewer oil rigs does not mean less crude, EIA says
The sharp decline in oil prices has had a significant effect on U.S. drilling activity, the EIA said. Citing data from oil-field services company Baker Hughes Inc. BHI, the EIA said there has been a 16% decline in the number of active onshore drilling rigs in the continental U.S. from the end of October through last week.
In a January outlook, the EIA forecast Brent crude to average $58 a barrel this year and $75 a barrel in 2016, with New York-traded West Texas Intermediate forecast to be lower than Brent’s by between $3 and $4 a barrel during those years.
Discussing how fewer operating rigs don’t necessary mean less production, the EIA gave the example of North Dakota in the 2008 downturn. Permits and drilling activity fell at the time, but “production rates did not decline as substantially,” the EIA said.

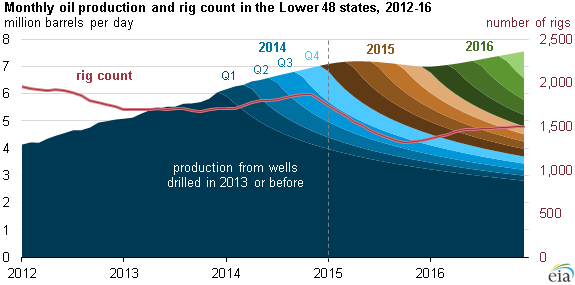
5. Lower 48 oil production outlook stable despite expected near-term reduction in rig count
Should its price forecast be realized, EIA projects that the number of operating rigs will decrease by approximately 24% from January to October 2015 before beginning to rebound in November 2015. However, the outlook for Lower 48 production reflects more than just the rig count. Other key factors include the efficiency of drilling, which EIA tracks in its Drilling Productivity Report, the rate of decline in production from existing wells, and changes in the amount of time between the start of drilling (called spudding) and the completion of the well.

6. Falling crude prices will leave oilfield services companies ‘parked,’ may trigger layoffs
CALGARY – Depressed oil prices will cause many producers to drill, but not draw from, new wells, with the result that oilfield service companies will suffer from the drop in activity, the head of the Petroleum Services Association of Canada said Tuesday
PSAC is now predicting 7,650 new wells will be drilled in Canada this year, which would mark a 32% drop from the 11,226 wells drilled in 2014.

7. China to keep 200 MMbbl crude hoard even if oil rallies
BEIJING (Bloomberg) -- China is poised to maintain its commercial hoard of more than 200 MMbbl of crude within three years even if oil rallies toward $130/bbl.
In terms of capacity, China can store 307 MMbbl of commercial oil inventory as of last year, CNPC said in its annual research report also published on Jan. 28. Strategic oil storage tanks, spread over six bases nationwide, can take a further 141 MMbbl, the company said.

8. Cease Fire? The Energy Report 1/28/15
Is OPEC getting ready to declare a cease fire in the oil production wars? OPEC Secretary-General Abdullah al-Badri said that a bottom in oil may be near and high level rumors of meetings between OPEC and Non-OPEC members are creating speculation that there may be some type of agreement in the works to curtail production. Even Saudi Aramco said it would postpone some projects as it appears low oil prices are even making some Saudi expansion unprofitable. While there have been many denials the talk has been making the rounds and it offered oil some support aided by the weakened dollar. Yet with U.S. oil supply rising over 12 million barrels yesterday according to the American Petroleum Institute and rising Iraqi production it is unclear as to how they can structure a cut that will make a difference in the growing global oil glut.
Today is a key day for oil! If oil is going to have a chance to bottom it will have to surge off record U.S. supply and the Fed statement. While there is no press conference most believe the Fed will keep their thoughts behind closed doors and not change the statement. In the meantime traders will look at the Gasoline demand numbers as well as refinery runs to see if there is any changes that might signal  are close to a bottom. $44 is the line in the sand for West Texas Intermediate.

9. Oil Prices: What’s Behind the Drop? Simple Economics
United States domestic production has nearly doubled over the last six years, pushing out oil imports that need to find another home. Saudi, Nigerian and Algerian oil that once found a home in the United States is suddenly competing for Asian markets, and the producers are forced to drop prices.

On the demand side, the economies of Europe and developing countries are weakening and vehicles are becoming more energy-efficient. So demand for fuel is lagging a bit.

Households will likely spend $750 less on gas this year because of the oil prices, the United States Energy Information Administration said Tuesday. Europeans and consumers around the world will enjoy similar benefits.

Finally, #10, from January 20th ...
5 Reasons This Crude Move is Unbelievable
It’s been one amazing sell off in Crude Oil; so amazing we can’t stop writing about it. We’ve covered the long term picture of CrudeThe Best Tweets from Crude’s DropHow to Play a Bounce , andeveryone else’s  articles on crude. But we can’t stop staring at it… We’re the commodity focused moth to the proverbial flame.
But why is this sell off so amazing? What’s special about it?

Tuesday, January 27, 2015

Don't Panic! Today's Must-See Charts on Earnings -- And How to Save Your Sorry Hide

You've probably heard the bad news about Caterpillar (CAT) and Microsoft (MSFT). Neither of them my picks, but when giants stumble, the earth trembles for all of us.

And Durable goods orders were a big miss, declining 3.4% against expectations for a 0.3% increase. Weaker activity in the oil patch is blamed. Wall Street is crapping its collective trousers, invoking Rule 48. The last time that happened was Oct 31, 2012.

Good times, good times.

I'm giving you context for what I'm going to show you next. I'm going to show you some scary charts. Don't panic, because I'll also tell you how small-caps -- yeah, beaten-down, unloved small-caps -- can save your butt in this quarter.

Anyway, let's start with the eyepopping charts from the Fat Pitch finance blog on Yahoo, under the headline: "2015 S&P EPS Growth May Be Half What Analysts Are Expecting"

As Fat Pitch tells us ...
just 18% of the S&P has reported, this is how the quarter is tracking: EPS growth of 0.3% versus an expected growth rate of 8.5% on September 30 when the quarter began; sales growth of 0.6% versus an expected rate of 3.7%.
Now the charts. First, revenue growth for S&P 500 companies by sector ...


EPS for the energy sector fell by 24% and sales by 17%. The sector has a weighting of approximately 15-20% (based on last year’s sales and EPS as a percentage of total sales and EPS, according to S&P). Excluding energy, 4Q EPS and sales growth would both be roughly 4%.

4% sales growth is close to the trailing four quarter average at the end of 3Q for the S&P. But 4% EPS growth is less than half of the 9% trailing four quarter average at the end of 3Q. That’s a big drop. What accounts for that difference?

Fat Pitch concludes that margins are plateauing.

Also ...
Energy is not the only sector being hit at the EPS level. Consumer staples EPS contracted by 2.5% in 4Q and financials contracted by 4.7%. Staples have probably been hit by the rise in the dollar; their foreign currency earnings repatriated to dollars will be impacted. This is true for all companies, in any sector, with large ex-US earnings. 
So, let's add the US dollar to the mix. And sure enough, Philip Morris (PM) is blaming the strong dollar for impacting its earnings.I think it will have plenty of company. 

By the way, here's a chart of the dollar, as tracked by the PowerShares Index.  I have gold on the bottom, because, y'know, it fascinates me.


(Updated chart)

You can see that the US dollar has been on a monstrous rally. Interestingly, it dropped quite a bit this morning, pushed lower by bad economic news and piss-poor megacap earnings (along with something else, which I'll get to). This has the potential for a pattern called an "Island reversal", which could cap the dollar rally in the short term.

The "potential" and "could" should tell you that nothing is set in stone.  Let's see what the weekly chart looks like. I will point out that gold has shown amazing strength during this rally.

But dang, if the dollar does start falling, gold is where you want to be, eh, amigo?

Oh, and there's something else pushing the dollar down which the media is not considering. And that is that the European Central Bank has unleashed a $1.27 TRILLION, 60-billion-euro a month bazooka to try and get its economy in gear. It's targeted at big banks, which is exactly where the money does not need to go. But what do banks do with the money? They put it in stocks, just like our banks did during QE 1 through QE Infinity. So that's going to push European stock prices up. And so now investors are selling out of US stocks (and dumping dollars) to go buy European stocks, and they need euros to do that. See how that works?

The point is, we are seeing weaker U.S. economic data, along with profits being hurt by low oil prices and a too-strong US dollar. That is usually not in the recipe book for higher U.S. stock prices.

Before you panic, let me mention three things.

1) The US economy is in a transition phase. We are moving away from energy leading growth to consumer spending leading growth. And most businesses will see a boost from low energy prices.

2) There are always winners and losers. Car purchases are expected to soar in 2015, unless consumers are lying to themselves and the people doing the surveys.

3) Small-Caps can be your lifeboat in this stormy financial sea. 

Why is that? Well, first of all, small-caps have much less exposure to foreign sales than large-caps. That makes them much less susceptible to a stronger dollar, as this chart from RBC makes clear ...


Second, small-caps have underperformed, market-wise for the last two years. This means that they are generally much better values than large-caps. They're not so inflated with air.

Finally, small-caps are more leveraged to economic activity than large-caps. And economic activity will get a boost from low oil prices.

That's not to say that if markets trend lower, small-caps won't go down.  It's hard to fight the tide. But small-caps should go down less on the dip and be more buoyant when the tide goes back up.

Because make no mistake, this is just a dip. This ain't the End of the World, as the mainstream media would have you believe.

But dips aren't nearly as headline-grabby as a disaster. 

Be smart, stay safe, good luck and good trades.

Monday, January 26, 2015

Today's Must-See Chart #2: Brent Crude Oil

Here's a monthly chart of the international crude oil benchmark, $BRENT. You can see that it is coming down to support.

I realize the supply/demand picture for $Brent has changed since it tested support around $43 and $40 years ago. However, there are many technical analysts in the market.  We can expect buyers to come in and defend those levels.

And while there could be panic spikes to the downside, I think $40 is probably where $brent will base this year.  But we'll see.


Visit StockCharts.com to see more great charts.

The US oil benchmark, West Texas Intermediate, trades at a discount to Brent, but that is changing. And Canada's oil benchmark trades at an even deeper discount.

People are trying to call a bottom in crude oil right now. Most recently, OPEC General Secretary Abdullah al-Badri made vague comments that they "will see some rebound very soon", based on nothing but his own intuition, I guess. Also, he said oil prices could reach $200 per barrel if there's a lack of investment following this price slump. This reversed oil's earlier price decline, when it seemed to be drifting lower (again) after new Saudi regent, King Salman Bin Abdulaziz, pledged to maintain the old king's policies. Since those policies seem to be to pump as much oil as they want, those comments hurt oil.

So who's right?  al-Badri or Abdulaziz? 

I'm seeing lots of articles on oil; certainly "bottom" speculation is high. Some may say that such a media frenzy is itself a sign of a bottom. I'm not so sure. What we need to see is global supply go down and global demand go up. THEN we can start bottom-calling.

Today's Must-See Chart #1: King Dollar

The US Dollar, as tracked by the PowerShares DB US Dollar Index Bullish Fund (UUP), continues to blast higher. This is a flight to safety as the euro is perceived to be in big trouble. 

Gold is still holding up relatively well, boosted by massive withdrawls of gold from the Shanghai Gold Exchange.  China withdrew 70 metric tonnes of gold from the SGE for the week ending January 16th.  That's the third-highest withdrawal ever.

The question becomes, how long can the dollar continue to go ballistic? At what point will a strengthening currency hurt America's export/import balance enough to weigh on our economy?

Also, can the euro ever get out of its own way again?

Visit StockCharts.com to see more great charts.

Friday, January 16, 2015

It's Nice to Own a Tanker Stock

For example ...
Visit StockCharts.com to see more great charts.
(updated link)

The more oil that is pumped -- and more will be pumped in the US this year and next year, according to the latest estimates -- the more oil has to be shipped.

The increase in production is happening despite lower prices. Production is expected to go up, just not as much as previously forecast.

Today's Must-See Gold and Dollar Chart

The US dollar continues to surge as shocked Europeans flee to the Greenback.  FX firms that played the Swiss Franc are going bankrupt

Remember also, the Ruble is collapsing, too.

But guess what else is holding up fine? Yep, gold. Even when it's priced in dollars. Because, as you've heard me (and others) say time and again, gold is the hardest of currencies.
Visit StockCharts.com to see more great charts.
(updated chart)

When the dollar finally takes a breather -- as it must -- what do you think will happen to gold? Gold usually moves INVERSE to the US dollar. I'd say gold has a chance to go ballistic.

We'll see how it plays out. Exciting times.

Thursday, January 15, 2015

Platinum is Breaking Out

Today's breakout in platinum gives us a target of $1,410 on the metal. Check out the bullish volume on the breakout, too.

Visit StockCharts.com to see more great charts.

Gold Explorers Trying to Break Out

The big move in gold today -- powered by the Swiss Franc unhooking from the euro -- is sending gold explorers higher. You can see the GLDX broke through overhead price resistance. Now, it is challenging a downtrend. Momentum has turned positive.


Visit StockCharts.com to see more great charts.

Tuesday, January 13, 2015

When the Paddy Wagon Comes Along, It Takes The Good Girls Along With the Bad

As you can see from this chart of West Texas Intermediate Crude Oil vs some major energy industry funds, when oil goes South, it drags everybody with it.

Visit StockCharts.com to see more great charts.


(link)

As Charlie Belida used to say, "When the paddy wagon comes along, it takes the good girls along with the bad."

Now, oil is primed for an oversold bounce here. Do you believe this is the bottom? Or is this a chance to get out of some losing positions at higher prices? And perhaps add some positions with short-oil exposure?

In $10 Trigger Alert, I've been recommending stocks that should do well as oil prices go lower (because energy is a major input for them OR they make more money when consumers have more money). What you do is up to you. Be careful.

Good luck and good trades.

UPDATE: Some supporting articles


Storing Oil At Sea Is About Futures Prices, Not Crude Oil Prices Rebounding

Some of the major oil trading firms are hiring oil tankers for up to 12 months.

Record natural gas production makes for bearish outlook

Dry natural gas production, according to the EIA, was at a record high in October for the eighth consecutive month.

According to the EIA’s projections, 2015 will be the tenth consecutive year of production gains, thanks to booming production from shale plays, especially the Marcellus.

US Oil production Continues to Rise

Last week, crude production increased to 9.13 MMbbls per day from 9.12 MMbbls per day the week before. In its December Short-Term Energy Outlook (or STEO), the EIA reported that output will hit 9.3 MMbbls per day in 2015, which is 700,000 barrels above the 2014 level.

Are energy MLPs finally feeling the heat of falling commodity prices?


Monday, January 12, 2015

Chart of the Day -- US Dollar

Here's a chart from StockCharts.com for $USD; I am including it in a $10 Trigger Alert issue going out today.


Visit StockCharts.com to see more great charts.