Thursday, April 30, 2015

Bullish Set-Up of the Day -- ONEOK Partners $OKS

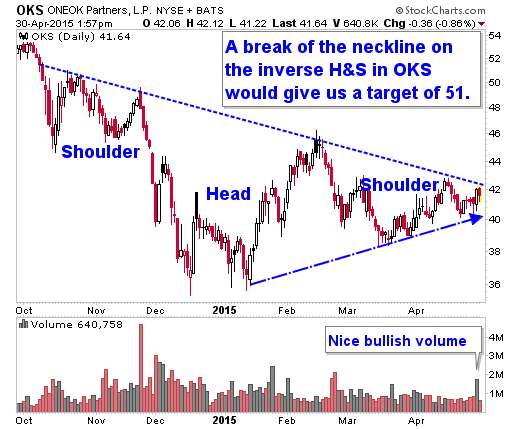
Sometimes a stock doesn't fit my $10 Trigger Alert, and it's not time for a pick in my Oxford Resource Explorer. And yet it looks so tempting. One such stock would be ONEOK Partners, with its 7.5% yield.

A bullish break of the neckline on this inverse head-and-shoulders set-up would really get me interested, though.

Visit StockCharts.com to see more great charts.
(Updated chart)

Don't buy something just because some dude on the Internet likes it. Do your own due diligence.

Wednesday, April 29, 2015

Radio Show Q&A on Oil, Saudi Arabia and Gas Prices Charts

I'm doing an interview with a radio show later today. Most of you won't be able to hear it, so I'm posting the questions they sent ahead of time and my answers. This isn't a script, but will form the basis for our conversation (hopefully).

Q. --The shakeup in Saudi Arabia leadership, what does it mean for oil prices if anything?

A -- Many people fixate on the fact that Saudi Arabia’s king has removed his half-brother as crown prince, replacing him with his nephew, and elevated his son to the position of deputy crown prince.

That's not a story that could affect oil prices in any way. Unless the fact that the new crown prince is a terrorist fighter and military man means war with Iran. I wouldn't bank on that, though.

But what many people are missing is that the same royal decree made Saudi Aramco chief executive Khalid al-Falih the Health Minister and chairman of Aramco. He reports to Saudi oil minister Ali al-Naimi.

Why is that important? Naimi is 79 years old and has been oil minister since 1995. He was crucial in Saudi Arabia's decision last November to not cut production in support of prices. He won't last in the job forever. 

Now, it looks like maybe Naimi will step down sooner rather than later. And Falih will replace him. 

It's likely that Falih will continue Naimi's policies. But nothing is guaranteed. So watch that space.

Q--Do you think the new changes in ministers will do anything different? What changes can we see?

A-- I would watch Naimi and Falih.  I expect Falih to replace Naimi sooner rather than later.


Q. --Will this create uncertainty in the oil markets?

A. -- When isn't there uncertainty in the oil markets? But here's a thing: Saudi Arabia just said that A) the oil market is in "excellent condition" B) it sees strong demand from Asia and C) it will supply China “with any additional quantities” of crude it may need.

Let me say that again: ANY 
additional quantities


If you want to talk certainty, I think the Saudis are certain they can keep producing at recent prices. For uncertainty, look to Iraq, Venezuela, Nigeria. Those could all remove supply from the market. And maybe sanctions will lift on Iran, putting more oil on the market.

Some more interesting stuff:

  • Saudi Arabia aims to cut its own crude consumption by 1.5 million barrels of oil equivalent a day by 2030.
  • Saudi Arabia will begin producing shale gas in 2016 at an initial output of 20 million to 50 million cubic feet per day, before raising it to 500 million in 2018 and 4 billion in 2025

Q. --What is keeping oil prices so low, is it the U.S. producing so much oil?

A -- Well, West Texas Intermediate crude prices are actually up quite a bit from their March lows. Roughly 35%, to $59 per barrel. 

Source

So, I wouldn't call oil prices low. And yes, we produce a lot of oil. In fact, Stockpiles rose another 1.9 million barrels in data reported today.  Stockpiles are at 80-year highs! Nonetheless, oil prices jumped on today's data because it wasn't as bad as traders feared. So, maybe the bottom is in. Maybe.

Q --With summer driving season not too far away, will prices stay low?

A -- Again, I wouldn't call prices low. But gasoline prices are certainly lower than last year. 

And oil prices should stay below $65 unless speculators run the table. Really, any big price moves to the upside are based on speculation.

Q, --What’s your view on oil prices? Do you expect prices to rise significantly in the near future?

A. If we based it on supply, no. The U.S. market is well supplied, and there is a 2 million barrel-per-day surplus in the global oil market. But speculators can push prices around. Never say never.
Tuesday, April 28, 2015

Is Doom Nigh for the US Dollar? Chart!

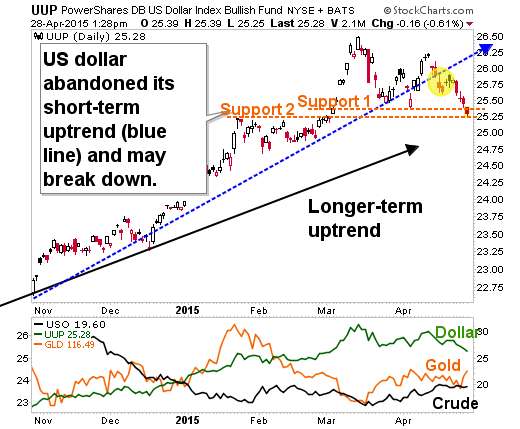
The US dollar is attempting to break down today, which is sending just about everything priced in dollars up.

Visit StockCharts.com to see more great charts.

(Updated chart)
  • You can see that the dollar has lost its grip on the blue short-term uptrend line.
  • It went under support 1. It is now testing support 2.
  • This breakdown is good for gold and miners
  • Surprisingly, it has not been as good for oil and oil-sensitive stocks. WTH?
  • Just because the dollar looks like it is breaking down, don't punch its ticket yet. The dollar has come back from the Cliffs of Doom© More than once recently. 
But if the dollar does break down, look for $UUP to test $24.85 followed by $24.50.

UPDATE: I just finished the other chart when I realized that UUP (and the US dollar) seem to be breaking the neckline of a head-and-shoulders pattern. Initial target for the breakdown would be $24.25 to $24.
To be sure, after breaking a neckline, it's often the case that the broken neckline will then be tested as overhead resistance before the final swan dive.

Where Does the S&P 500 ($SPX) Go From Here?

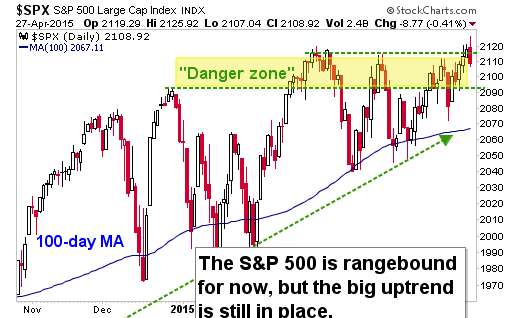
Looking at my go-to chart of the S&P 500, we can see that the index suffered an outside reversal day yesterday. While some technical analysts (Gartman!) will be all over this, it came on low volume, so don't read too much into it.

Visit StockCharts.com to see more great charts.
(Updated chart)

This puts the S&P 500 squarely back into the "danger zone". We could see a dip to support around 2095, but it could dip to test deeper support around 2060-2070 as well.

One thing to keep in mind: The Fed will release its FOMC statement at 2:00 p.m. ET on Wednesday. The market usually sells off into those statements. So, that's more grease for a downside move (at least until Wednesday at 2).  I'll remind you that while the market usually sells off into the meeting, it then usually rallies after the announcement.

You may be wondering what I think about precious metals -- and, yes, I'm so glad that $10 Trigger Alert subscribers recently entered Silver Standard Resources (SSRI), and that Oxford Resource Explorer subscribers have been loading up on precious metal stocks. But there is a lot to talk about there. I'll try to put that in another post.

Thursday, April 23, 2015

$TRP Is Very Close to My Initial Target -- What's Next?

If you read this blog on a regular basis ... well, first of all, get help. But seriously, you'll remember that on April 15, I posted chart of TransCanada Pipelines and gave an initial target of $47.50. It is very close to that initial target now. 

Visit StockCharts.com to see more great charts.

(Updated chart)


That's just the initial target, of course.  I think $56 is likely, but we'll see. Anyway, good news for Oxford Resource Explorer subscribers.


Monday, April 20, 2015

Gold Miners Look Good Here ... Guess What Looks Better?

Here is a series of charts I am watching.

First, the US Dollar, as tracked by the PowerShares DB US Dollar Index Bullish Fund (UUP). Despite the fact that it is rallying today, it has fallen below its trendline of the last six months. Its rally seems to be stagnating.


And gold still can't get out of its own way. It is down today as well.

But take a look at the Market Vectors Gold Miners ETF (GDX).  You can see that miners are recovering nicely ...


We don't want to give this the "all-clear" yet because the metal isn't following ... yet. Now, miners usually lead the metal. So, it's likely that gold miners are putting in a bottom and the metal will follow. This seems more likely when you see that the miners seem to have put in a double bottom ...

(Updated chart)

I think that looks pretty bullish for miners. The metal should follow.

That said, there's something that's acting even more bullishly. And that's energy producers ...


(Updated chart)

Even though the Saudis have added enough extra production to equal HALF A BAKKEN per day, oil prices are recovering nicely and oil producers right along with it. That kind of action in the face of what should be bearish news is very bullish.

Just some things to keep in mind.

Wednesday, April 15, 2015

Update on $TRP -- Breakout!

Last week I posted some charts on TransCanada Corp. (NYSE: TRP), a big North American pipeline company.  Let's revisit one of those charts ...

Visit StockCharts.com to see more great charts.
(Updated chart)

Many energy stocks seem to be bottoming here. 

S&P 500's Danger Zone Revisited

You can see that the S&P 500 is back in the "Danger Zone." Two previous attempts to break out there were met with selling.

Visit StockCharts.com to see more great charts.
(Updated chart)

That said, the index's big uptrend is intact. And breakouts usually come when things look toppy. Sentiment has been turning more negative as earnings estimates have been slashed due to the falling U.S. dollar. This could be just the environment for an upside surprise.


Tuesday, April 14, 2015

Weird Science

I had a twitter conversation about unicorns. We know they're myth. But if they were real, would they reveal themselves?

And one person asked: "What if I am a unicorn?"

This got my writer's brain thinking. Why would unicorns stay in the shadow? And how would the pulps of the 1930s handle it?

Idea #1: Respectable society fears the hypnotic effect that unicorns' music and lifestyle has on our vulnerable women-folk. 

Idea #2: Unicorns stay hidden out of justified fears of persecution.

Both covers were made HERE

Fact of the day: The historical word for the horn of a unicorn is alicorn.

Friday, April 10, 2015

Bull of the Day: TRP. Two Must-See Charts

Subscribers to Oxford Resource Explorer own Transcanada Pipelines (TRP). TRP is a Canadian/North American pipeline company with a market cap of $31.3 billion and tens of thousands of miles of pipeline. 

We're seeing a potentially very bullish set-up here.

First, let's look at a longer-term (7-month-long) chart ...

(Updated chart)

You can see that TRP has been moving higher since mid-March. Now, it is testing its big downtrend.

Now, let's take a closer look ...

Visit StockCharts.com to see more great charts.

(Updated chart)

You can see a few things here ...

  • The volume on up days is better than volume on down-days. That's a good indicator of bullishness.
  • TRP seems to be forming an inverse-head-and-shoulders pattern. We won't know until it confirms a break above the "neckline" of the pattern (that orange dotted line).
  • A breakout above that neckline would give us a target of $49 a share.
TRP currently sports a dividend yield of 3.8%.  I think the hullabaloo over the XL Pipeline is overdone. TRP has a lot of good things going for it. 

Just something to consider. Don't buy something just because some dude on the Internet likes it. Do your own due diligence.

$SPX -- Highway to the Danger Zone!

Do I have to say it? Do I really have to say it, Lana? Let's look at Chart #1 ...

Visit StockCharts.com to see more great charts.
(Updated chart)

Yes, the S&P 500 is starting Friday in the DANGER ZONE!


Chart #2:  I said this was an important week for the US Dollar (which tested its uptrend earlier this week), gold and crude oil. The day's not over yet. But this is how it looks to turn out.

Have a great weekend. By the way, April 11 is International Tabletop Day. It's a day when you celebrate board games by playing them (a lot). No, not Monopoly. Great games. The new games. The games that will lift your soul and strengthen your friendships. So get out and play.

Wednesday, April 8, 2015

Can the US Dollar Hold Its Rebound? #Gold #Oil

We return to the chart of the PowerShares DB US dollar Index Bullish Fund ($UUP) to check on the status of the greenback. On Monday, it dipped below its short-term uptrend; on Tuesday it peeked back above that trendline.

Can this rebound hold?

Visit StockCharts.com to see more great charts.
(Updated chart)

The last time the US dollar faked a breakdown -- in December 2014 -- it led to a 12% rally. That said, this rally is getting long in the tooth. And the US Dollar has structural and political problems that I've written about elsewhere.

Stay tuned. This is a crucial week not only for the US dollar, but for gold and crude oil and well.

Monday, April 6, 2015

US Dollar Falls Below Uptrend. What Happens Next? #Gold #Oil

The US Dollar Index, as tracked by the PowerShares DB US Dollar Index Bullish Fund, has fallen below its short-term uptrend. This is because the market realized over the weekend that the Fed has plenty of breathing room on raising interest rates. This, in turn, is due to recent weak economic data.

Visit StockCharts.com to see more great charts.
(Updated chart)

You can see the dollar's weakness is putting a bid in gold. Crude oil is up more than 5% today, and is threatening the high it put in the week before last.

If the US dollar doesn't recover soon, then the short-term uptrend in broken. It still has longer-term support, but we'll how that plays out.

China's stocks are blasting off ($FXI)

The mainstream media analysts keep wringing their hands over China. They worry it's going to slump. You know who's not worried? Chinese investors. Check out this chart of the FXI, an ETF that tracks large Chinese stocks.

Visit StockCharts.com to see more great charts.
(Updated chart)

The FXI looks to be on its way to $65. That's a 40% move from recent prices.

If you think the FXI isn't representative enough, look at a chart of the iShares MSCI China Index fund ($MCHI). You'll see the same breakout.

Have a great Monday.

Thursday, April 2, 2015

$SPX and the "Danger Zone"

In yesterday's $10 Trigger Alert issue, I included a chart of the S&P 500 and what I call the "Danger Zone."

Visit StockCharts.com to see more great charts.
(Updated chart)

The index hit a high in December of last year, and tried to push above it twice since - in February and March. Each time, it has pulled back but found support at the 100-day moving average and uptrend.

It’s likely we’ll see the S&P 500 test that overhead resistance again. We’ll have to watch it closely when it’s in that “danger zone” between the December and February highs. When the S&P 500 pushes into the Danger Zone, the longs take profits and short sellers pile on and drive it lower.

We need the S&P 500 to push up through the danger zone before stocks can really take off. If the S&P 500 can break out over those old highs, it should be led higher by small caps. 

If the S&P 500 rolls over and breaks through support, then we’ll have to look for stocks that aren’t moving with it. After all, there’s always a bull market somewhere. I have ideas on that, which $10 Trigger Alert subscribers are aware of (as of Wednesday).

Of course, fans of TV's Archer know what can happen in the Danger Zone ...

This Friday is Good Friday, and Passover starts on Friday night. Volume is already  light. And when volume is light, weird things can happen in the market. So be wary of that.