This was part of the material cut from my story that is running in the Non-Dollar Report's Daily Grind today ...
(Updated chart)
There are multiple forces keeping the U.S. dollar strong. One of those forces – and this next one may knock
you over, so find a soft place to land before you keep reading – is a
shortage of U.S. dollars.
I
know, right? We have one of the most spend-thrift governments in the
world, and our national debt is at nosebleed levels. But in the world of
international trade, there’s
a shortage of dollars … thanks to America’s energy boom.
The
total U.S. dollars available to foreigners is shrinking. That’s because
America used to ship vast quantities of dollars overseas to pay for
oil. But U.S. crude oil production
has jumped 76% since 2011. That’s a whole bunch of money we don’t have
to pay Saudi Arabia, Venezuela, Nigeria and other oil-oozing
international riff-raff.
And the crude we do import is at cut-rate prices. Oh, how your heart must be breaking for the squeezed oil sheiks.
Here’s
the thing: That money we used to send overseas sloshed around in
international markets. We’ve cut our overseas oil payments by about $240
billion a year since 2011.
That’s money that is no longer available globally, meaning there is a
shortage of dollars.
And what happens when there’s a shortage of something? The value goes up! This makes the dollar stronger.
The stronger dollar not only tightens monetary conditions in the US. China keeps its currency in a band against the US dollar, a sort of peg. And that's one of the reasons why China has devalued its currency three times this week. Our dollar is getting too strong, and dragging China's yuan (or renminbi) along with it.
"In the Valley of the Blind, the One-Eyed Man Is King." Market charts, analysis and links
Showing posts with label US Dollar. Show all posts
Thursday, August 13, 2015
Wednesday, May 20, 2015
The US Dollar Bangs Its Head -- What's Next?
It's time to check in on my favorite chart of the US Dollar Index, as tracked by the PowerShares DB US Dollar Index Bullish Fund (UUP) ...

(Updated chart)
Here is commentary I sent my $10 Trigger Alert subscribers along with this chart on Tuesday ...
You can see the dollar broke its big uptrend and went to test support at its first Fibonacci support level. Fibonnacci numbers are named after a 13th-century mathematician Leonardo Bonacci Fibonacci. He was the first to notice that these numbers and their ratios appear in nature over and over again. For better or worse, technical analysts use these numbers in trading all the time.
I think technicians saw the US dollar test its Fibonacci support and bought it for a quick rally. But the fundamentals of the US dollar haven’t changed …
So, it’s likely the dollar will bang its head on its former uptrend, which has turned into overhead resistance.
That’s the big picture. In the shorter-term, smaller picture, gold and silver are taking it on the chin today. Since gold and silver are priced in dollars, they often go down when the dollar goes up.
The good news is we could see another buying opportunity ... (sorry, the rest, including my estimate on when that buying opportunity will come, is for subscribers)
Update: The FOMC meeting notes were positively doveish.

(Updated chart)
Here is commentary I sent my $10 Trigger Alert subscribers along with this chart on Tuesday ...
You can see the dollar broke its big uptrend and went to test support at its first Fibonacci support level. Fibonnacci numbers are named after a 13th-century mathematician Leonardo Bonacci Fibonacci. He was the first to notice that these numbers and their ratios appear in nature over and over again. For better or worse, technical analysts use these numbers in trading all the time.
I think technicians saw the US dollar test its Fibonacci support and bought it for a quick rally. But the fundamentals of the US dollar haven’t changed …
- The long dollar trade is the most overbought trade in the world
- The US economy is showing signs of weakness while Europe and Japan are showing signs of coming back to life
- Guesstimates of when the US Federal Reserve will next raise benchmark interest rates are being pushed further into the future.
So, it’s likely the dollar will bang its head on its former uptrend, which has turned into overhead resistance.
That’s the big picture. In the shorter-term, smaller picture, gold and silver are taking it on the chin today. Since gold and silver are priced in dollars, they often go down when the dollar goes up.
The good news is we could see another buying opportunity ... (sorry, the rest, including my estimate on when that buying opportunity will come, is for subscribers)
Update: The FOMC meeting notes were positively doveish.
Monday, April 20, 2015
Gold Miners Look Good Here ... Guess What Looks Better?
Here is a series of charts I am watching.
First, the US Dollar, as tracked by the PowerShares DB US Dollar Index Bullish Fund (UUP). Despite the fact that it is rallying today, it has fallen below its trendline of the last six months. Its rally seems to be stagnating.
But take a look at the Market Vectors Gold Miners ETF (GDX). You can see that miners are recovering nicely ...
We don't want to give this the "all-clear" yet because the metal isn't following ... yet. Now, miners usually lead the metal. So, it's likely that gold miners are putting in a bottom and the metal will follow. This seems more likely when you see that the miners seem to have put in a double bottom ...
(Updated chart)
I think that looks pretty bullish for miners. The metal should follow.
That said, there's something that's acting even more bullishly. And that's energy producers ...
I think that looks pretty bullish for miners. The metal should follow.
That said, there's something that's acting even more bullishly. And that's energy producers ...
(Updated chart)
Even though the Saudis have added enough extra production to equal HALF A BAKKEN per day, oil prices are recovering nicely and oil producers right along with it. That kind of action in the face of what should be bearish news is very bullish.
Just some things to keep in mind.
Wednesday, April 8, 2015
Can the US Dollar Hold Its Rebound? #Gold #Oil
We return to the chart of the PowerShares DB US dollar Index Bullish Fund ($UUP) to check on the status of the greenback. On Monday, it dipped below its short-term uptrend; on Tuesday it peeked back above that trendline.
Can this rebound hold?

(Updated chart)
The last time the US dollar faked a breakdown -- in December 2014 -- it led to a 12% rally. That said, this rally is getting long in the tooth. And the US Dollar has structural and political problems that I've written about elsewhere.
Stay tuned. This is a crucial week not only for the US dollar, but for gold and crude oil and well.
Thursday, March 5, 2015
Chart of the Day -- US Dollar and Gold
The US Dollar Index hit a new 11-year high yesterday. This was mainly due to positioning ahead of today's European Central Bank announcement, so there may be a whiplash. But the bottom line is King Dollar continues to show strength.
With the dollar making an 11-year high, you might expect gold to be making new lows. After all, gold is priced in dollars. But, no, while gold is testing support around $1,200, it's actually holding above lows hit in the last quarter of 2014
(Updated chart)
So, what does this mean? I'll be sending a new report on gold to $10 Trigger Alert subscribers soon; I'll lay my cards on the table at that time.
Be careful, but also be ready to seize opportunities.
Thursday, December 18, 2014
Fascinating Chart Action on Dollar and Gold
I find the chart action in the US dollar (as tracked by the UUP fund) and gold (as tracked by GLD) fascinating. I'm kind of a geek that way, but see if you find it interesting.

(Updated chart)
Here's the thing. We can all see the U.S. dollar looks poised to go to new highs. That should happen, unless emerging markets like Russia make a miraculous recovery, Japan finds a recovery concealed in its kimono and Europe finds that recent deflation is all just a bad dream.
However, while the dollar pushes to new highs, gold is off its lows. It hasn't even tested low it made back in November. How do you like them apples? What does it mean? Hmm...
Saturday, October 11, 2014
Big D, Double O, Small M. That Spells 'Doom', Baby!
It is likely, though not required, that the small-cap Russell 2000 (tracked by IWM) will make an attempt to test its broken support as overhead resistance. If you are in a mind to go short, that might be a good time. In the bearish case, look for a test of 97, and probably 90. Anything under 83 is brown-trousers time.
Updated chart
I've drawn the Fibs from the 2011 pullback, the most recent big pullback. 2009 was deeper, of course. The question is, do you think we're in 2008-2009-type trouble, or 2011-type trouble? 2011 was mostly political. Europe was in a real pickle. Europe is in political trouble again today. The Germans refuse to do stimulus spending when it's obvious that it is required. I see other similarities between 2011 and now.
Just remember that every political crisis ends.
But for now, the euro is under pressure (as is the yen, as is the rouble) and the US dollar reigns supreme. This is happening despite widespread and ongoing "analysis" that the U.S. dollar is already sliding toward an abyss. This analysis is taking place in a background where the U.S. dollar is up 7% so far this year. And people are lapping it up.
Why is the U.S. dollar so strong? As I've said many times this year, the U.S. dollar is winning a beauty contest in a leper colony.
- It's not that our currency is so great, but the others look like hell.
- It helps that the U.S. deficit (not the national debt) is falling like a proverbial rock.
- Our economy is outperforming other economies.
So of course the US dollar is going up.
Source: New York F*cking Times
What does this kind of rally in the US dollar mean? Anything priced in dollars gets crushed. If you are a bit forward thinking, just remember that nothing goes up in a straight line. There will be a correction in the dollar. When that happens, a lot of things that have been under pressure are going to go ZOOM!
By the way, I have my own reasons for thinking the U.S. dollar is heading for a haircut in the longer term, and it has little to do with the reasons being pushed by the crackpot chorus. It has a lot to do with China, Russia and Saudi Arabia. More on that another time.
Next question: Would I play energy for a bounce here? My Gold & Resource Trader subscribers are long ProShares UltraShort Oil & Gas (DUG) ... again ... and it's a nice cushion considering what happened to some other positions. A while back, I gave my own target of $85 as a Come-to-Jesus moment for the oil industry, especially the Saudis (maybe a Come-to-Allah moment, then). And this past week, West Texas Intermediate, the U.S. oil benchmark, hit $85 and bounced (international oil prices remain higher, but way off their own highs).
So is that it for the oil pullback? Is this parade of pain finally over?
To put a floor under oil prices, two things need to happen. The US dollar needs to stop going up, though that is secondary. The main thing is that oil production needs to stop going up. Those sad sacks who write to me with frothy, fear-dripping tales about ISIS and the Iraqi oil fields -- zip it. No one cares about your theories about what ISIS will do, Field Marshall Monty. I'm sure you have a mainline to ISIS strategy HQ, right? Yeah, right.
In the real world, don't expect US oil companies to shut in any production until $70 or so. So that leaves Saudi Arabia. The central bank of oil. You might think the conservative Saudis would cut production to boost prices. That would be a costly assumption, at least so far. The House of Saud recently cut prices to match Brent Crude to preserve market share. What will the Saudis do now?
I thought pipelines would be a refuge in the oil pullback, because they make their money on oil flow (which is still going up), not prices. Clearly, I was wrong. When traders got scared, they dumped everything. I do think pipelines are a great buy on the pullback, because North American production is likely to keep rising if the price of oil stabilizes above $80.
By the way, lower oil prices are generally bullish for the non-oil economy.
But we shall see.
Other Reading
4 Forces That Are Driving Down Oil Prices -- and Could Drive It Lower (That's my original headline; the headline the editor put on this is WTF, but whatchagonnado).
Russia is "Spear Phishing" -- and You're the Fish
Grumpy Gold Men
Thursday, August 7, 2014
A Tale of Two Charts (Gold & The Dollar)
I'm super-busy this morning -- putting on a new trade and grabbing gains -- but here are two charts I need to share with you.
First, an updated version of the weekly chart of the Dollar Bullish Fund (UUP) that I showed you on July 28. It tracks the US dollar Index closely.
(Updated chart)
You'd think a test of #2 looks like a certainty, right. Except that nothing is certain in the markets, and there is ALWAYS another chart.
Next, here is a daily chart of the UUP, and below that, I've put gold vs the dollar. Gold USUALLY goes in the opposite direction of the US dollar, but not always. They both rallied this week because of geopolitical fears, among other reasons.
(Updated chart)
The daily chart of UUP looks like it is running into trouble -- just as it gets close to that overhead resistance. While the resistance line may still act like a magnet, it sure looks like sellers are chomping at the bit to sell the greenback.
That could be good for gold. But we'll see. Good luck today.
Monday, July 28, 2014
Chart of the Day: The US Dollar
Here's the chart of the day -- the US Dollar, as tracked by the Powershares DB US Dollar Index Bullish Fund (UUP) ...
(Updated chart)
Let's check back on this one later this week, as the US Dollar looks poised for a breakout. You can see that it is testing overhead resistance, and the volume on the up days is larger than the down days. RSI, a short-term momentum indicator, has given a weekly buy signal.
What's happening with the dollar? The official view, to quote Reuters ...
We'll see how the market reacts to jobs data later this week, as well as Fed comments on interest rates. Now, won't this be bad for gold? Potentially. But while gold and the dollar often move in opposite directions, they CAN move in the same direction under the right circumstances. And I think we're in those circumstances now. But we'll see.
Let's check back on this one later this week, as the US Dollar looks poised for a breakout. You can see that it is testing overhead resistance, and the volume on the up days is larger than the down days. RSI, a short-term momentum indicator, has given a weekly buy signal.
What's happening with the dollar? The official view, to quote Reuters ...
A string of recent strong economic data has increased speculation that the Fed will hike interest rates sooner than expected.To that, I'd add that geopolitical troubles and a potential worsening of Europe's slowdown are also making the dollar attractive. Despite the wailings of the Weeping Wandas on Wall Street, the U.S. is still outperforming other major economies. The U.S. economy is expected to expand 1.7% this year (That's a Reuters consensus estimate, I've seen other estimates that are higher), while Eurozone countries are expected to trudge along at 1% growth.
The U.S. dollar hovered near six-month highs against a basket of major currencies early on Monday, holding on to solid gains made last week.
We'll see how the market reacts to jobs data later this week, as well as Fed comments on interest rates. Now, won't this be bad for gold? Potentially. But while gold and the dollar often move in opposite directions, they CAN move in the same direction under the right circumstances. And I think we're in those circumstances now. But we'll see.
Thursday, May 29, 2014
Update on US Dollar Chart
I've been busy all month, and haven't had a chance to update the blog. My apologies.
On May 1, I posted a chart of the US Dollar Index, talking about the potential for the dollar to rally in May, as it has every May for the past 5 years. I also had a story in FreeMarketCafe.com's Daily Grind that explained the Dollar's May rally effect in more detail. I called it "The Single Most Successful Investment in May."
Time for an updated chart ...
(updated chart)
So how does the US dollar perform in June ... or in the rest of the year? Here's a chart ...
Maybe it's time to bank those dollar profits, if you got 'em.
Thursday, May 1, 2014
US Dollar at Support -- Will it Break Down or Bounce?
It's time to place your bets folks. The US dollar is at support ...
(Updated chart)
Over the past five years, the US dollar has rallied every May. Is that going to happen this time around? We'll see. As for gold -- Dollar weakness isn't helping it. Maybe dollar strength will help.
(Updated chart)
Over the past five years, the US dollar has rallied every May. Is that going to happen this time around? We'll see. As for gold -- Dollar weakness isn't helping it. Maybe dollar strength will help.
Monday, April 28, 2014
The Relationship Between Gold and The Dollar
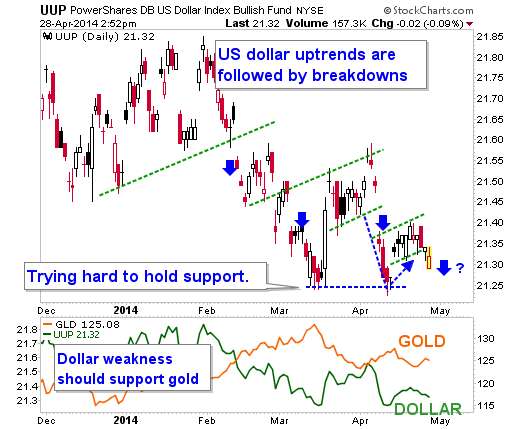
I'm watching the U.S. dollar very closely here. Check out this chart from StockCharts.com for the PowerShares DB US Dollar Index Bullish Fund (UUP)

(Updated chart)
You can see that the U.S. dollar drifts higher, then breaks lower, over and over again. Most recently, bullish action in the euro is weighing on the dollar.
Other thoughts ...

(Updated chart)
You can see that the U.S. dollar drifts higher, then breaks lower, over and over again. Most recently, bullish action in the euro is weighing on the dollar.
Other thoughts ...
- Since gold is priced in dollars, more weakness in the dollar should be supportive for gold. It's worrisome that gold hasn't done better considering the slump in the dollar. But maybe the price in New York has yet to catch up with the fundamentals.
- And to be sure, all eyes are on the FOMC meeting this week.
- Speaking of gold, the most recent news out of China can be seen as a positive. The latest figures from Hong Kong suggest that gold demand in China is yet again heading for a new record in 2014.
- However, in India, farmers are concerned over a weak monsoon, which would drastically affect their crops. And that is probably dragging on gold.
Friday, March 14, 2014
Useful Chart of Monthly Price Movements in Gold
I'm not sure historical monthly movements in the price of gold matter anymore. There was a real disconnect in the fourth quarter of last year. Still, I want this chart for reference to compare this month's price action.
First, the trend in gold in US dollars ...
Then the action in gold priced in dollars and other currencies ...
We'll see how this month shapes up.
First, the trend in gold in US dollars ...
Then the action in gold priced in dollars and other currencies ...
We'll see how this month shapes up.
Thursday, February 20, 2014
What If I'm Wrong on Gold?
Yesterday, precious metals pulled back sharply, and they look to continue the pullback today. Gold miners gave up about three or four days' of gains in one day, and look to give back more today. The main impetus for this seems to be disappointment over the release of the Federal Reserves' minutes from its January meeting, which were less "dovish" than some hoped.
Since gold and silver were so overbought, a pullback isn't surprising. But I think Wall Street believes this is the start of something bigger.
The reason I think that is because I'm on friendly terms with a Wall Street economist, and we've been emailing back and forth on the subject. Yesterday, he sent me this summary of his thoughts:
This would mean that Wall Street economists are completely ignoring the tremendous demand we are seeing in China. And if the Gold ETFs do a "tapering" of their own -- stop selling gold at the breakneck pace of last year -- where will the Chinese get their gold?
I think Wall Street could be in for a heck of a surprise. But we'll see. Maybe I'm the one who's wrong about gold. But I don't think so.
I think the short-term weakness in gold is due to strength in the US dollar. The dollar and euro got to the same inflection point that they always move from. And yesterday's Fed minutes added to dolllar strength by cooling dovish hopes.
On my blog, I've been following a chart of the UUP ...
(Updated chart)
In the short term, the dollar/UUP could rally to the bottom of the broken up-channel (that red dotted line on the chart). That might take a week. Timing is always difficult. Anyway, the pullback will provide the next opportunity to get long precious metals and miners.
And if I'm wrong -- well, we have stops in place to protect open gains. We can always buy again later at cheaper prices.
Good luck and good trades,
Sean
Since gold and silver were so overbought, a pullback isn't surprising. But I think Wall Street believes this is the start of something bigger.
The reason I think that is because I'm on friendly terms with a Wall Street economist, and we've been emailing back and forth on the subject. Yesterday, he sent me this summary of his thoughts:
"The recent rally in gold is more related to the labor market and the 'problems' it might pose for the Fed in tapering its purchases. So you can see from today’s minutes that the FOMC remains locked-in to the theme of an improving economy. Its gentle taper should really hurt gold but for now it is not, which is down to the weather-related pause in job creation. I expect that gold might fall once job creation in the spring returns to 200k+ per month.
"Gold will also dislike any mention of lifting the fed funds rate, although as my note points out, those arguing for a nearby lift off for the fed funds rate were easily put down at the January meeting. Rising treasury yields, which would accompany resurgent economic activity, would also harm gold."So, his view is that the rally in gold is due to weak jobs numbers -- period. That is, anticipation that the Fed will have to alter its tapering of the QE program. My economist friend believes better jobs numbers are coming, and that will sink gold.This may be the consensus view on Wall Street.
This would mean that Wall Street economists are completely ignoring the tremendous demand we are seeing in China. And if the Gold ETFs do a "tapering" of their own -- stop selling gold at the breakneck pace of last year -- where will the Chinese get their gold?
I think Wall Street could be in for a heck of a surprise. But we'll see. Maybe I'm the one who's wrong about gold. But I don't think so.
I think the short-term weakness in gold is due to strength in the US dollar. The dollar and euro got to the same inflection point that they always move from. And yesterday's Fed minutes added to dolllar strength by cooling dovish hopes.
On my blog, I've been following a chart of the UUP ...
(Updated chart)
In the short term, the dollar/UUP could rally to the bottom of the broken up-channel (that red dotted line on the chart). That might take a week. Timing is always difficult. Anyway, the pullback will provide the next opportunity to get long precious metals and miners.
And if I'm wrong -- well, we have stops in place to protect open gains. We can always buy again later at cheaper prices.
Good luck and good trades,
Sean
Wednesday, February 19, 2014
6 Gold Stories for Wednesday, & 1 Chart
1. Global Gold Coin And Bar Demand Surged 28% To Record 1,654 Tonnes In 2013
The World Gold Council's "Demand Trends Full Year 2013" shows that China became the world’s largest store of wealth buyer of gold in 2013. They are not consumers as only a tiny fraction of gold is ever consumed. Chinese people bought a record 1,066 metric tons of gold last year, as sudden price falls led to a 32% jump in bars, coins and jewelry buying.
China’s increased purchases helped limit the decline in gold prices as western speculators and investors sold 869.1 tons through exchange-traded products backed by bullion.
2. 'Dama' women behind much of China's current gold demand
Massive gold purchases by Chinese `dama' investors - bargain-hunting, middle-aged women - may have propelled China past India as the largest gold consuming country in the world this year.
According to the Xinhua News Agency, the surge in gold demand seen in China was helped by frenzied purchases by these `damas', who were eager to chase cheap deals.
this group consisting mainly of married women between 40 and 60 years of age, grabbed the attention of the world for the first time in 2013. The Wall Street Journal specially created the term `dama' to showcase the urgency of the Chinese ladies in the gold market.
In the wake of the gold price slump in the international gold market, Chinese investors, mostly mothers, spent around 100 billion yuan to buy 300 tonnes of gold within 10 days.
3. The World Gold Council Clueless on Chinese Gold Demand?
The World Gold Council released the Gold Demand Trends for Q4 2013. According to this report total 2013 Chinese consumer demand was 1,065.8 tons. In my opinion this number is highly disputable.
The consequence/purpose of the structure of the Chinese gold market is that SGE withdrawals equal wholesale demand. In 2013 SGE withdrawals accounted for 2197 tons.
How come there is such a big difference between Chinese demand reported by the WGC, 1066 tons, and wholesale demand, 2197 tons? Why is the WGC missing 1132 tons? One reason is because the Chinese are hiding it. Since 2008 the Chinese have great interest to hoard in the dark in order to diversify their US dollar reserves, strengthen their economy and protect it from external shocks. The China Gold Association (CGA) changed the way they measure demand and all other Chinese gold institutions ceased publishing reports on demand since 2011. The only valuable information they continue to publish are SGE withdrawals.
4. The big gold ETF turnaround and its prospective impact
Chinese and Indian demand alongside high demand levels from a number of other countries, mostly in the East, Middle East and FSU, was perhaps more than countered, as far as the Western gold markets were concerned, by the enormous turnaround in the gold ETFs in 2013. The WGC figures put gold ETF outflows of 880.8 tonnes as against ETF intakes of 279.1 tonnes in 2012. Thus this comes out as a massive turnaround of 1,159.9 tonnes in effective market supply, which was almost certainly, although unspecified as such, the key driver forcing down gold prices in the West in 2013.
Now there are indications this year, although it is early days yet, that the outflows from the ETFs may have ended and may even be being replaced by small inflows.
5. Gold ETP Holdings In Biggest Jump Since December 2012
total gold holdings in exchange traded products rose by 3.2 tons, the biggest weekly increase since December 2012. Holdings in silver, which rallied more than 7 percent last week, jumped by 104.2 tons.
With two weeks gone, February could be on track to show the first monthly increase in ETP holdings since December 2012 as many investors who left the market last year may be tempted to get involved once again.
6. India's Smuggled gold doubles to 200 tonnes in 2013
According to estimates by the global precious metals consultancy GFMS, 150 to 200 tonnes were smuggled in 2013 from Dubai, Singapore and land routes of Bangladesh, Pakistan and Nepal. The agency estimated 112 tonnes had been smuggled in 2012.
7. US Dollar Tries to Bounce
Here is the chart of the PowerShares DB US Dollar Index Bullish Fund that I've been following ...
(Updated chart)
It looks like the US dollar wants to rally from support, but it's a pathetic bounce so far.
UPDATE: The Fed minutes released today (from January's meeting) seem to have put a bid in the U.S. dollar. This is weighing on gold. We'll see how far and long the dollar rally/gold correction goes.
Good luck, and good trades,
Sean
Thursday, February 13, 2014
Gold Rockets as US Dollar Gets Crunched -- Chart
Gold tested $1,300 today. Let me show you one reason why ...
I'm putting together a Gold & Resource Trader issue for tomorrow, including this chart of the PowerShares DB US Dollar Index Bullish Fund (UUP), which tracks the US dollar ...
(Updated chart)
As you can see from the chart, the dollar crumpled like wet tissue paper on Thursday. Traders are blaming the swoon on the weak jobs and retail numbers, and that may have something to do with it. Weak jobs give the U.S. Federal Reserve another reason to keep up its quantitative easing program or find some other way to goose the economy with easy money.
And that is very good for gold. And your open gold miner positions.
I have a bunch more stuff in tomorrow's issue of Gold & Resource Trader. Subscribers should stay tuned.
Monday, February 10, 2014
Is the Gold Bull Back?
Gold is rallying nicely above the $1,271 level I told subscribers to watch. However, for those gold bulls that are my readers, I have to tell you that this is just the first of some technical hurdles that gold has to push through.
Next comes $1,300, but that's more psychological than anything. And after that, Gold will need to break through the $1,327 level. IF -- and I say IF -- gold can do that, then we'll be back in a bull market.
Now, here is some of what I am watching on gold ...
1. It's Official -- Chinese Gold Imports Surged in 2013
China's gold consumption jumped 41% in 2013 to exceed 1,000 tonnes for the first time, an industry body said on Monday, as a sharp slide in prices attracted buyers for jewellery and bullion.
The demand surge has helped China become the No. 1 gold consumer and should support prices, which took a hit last year from expectations of a tapering of commodities-friendly economic stimulus by the US Federal Reserve and a drop in demand in the other major buyer India.
Some highlights from the story ...
2. Shanghai Gold Sales Soar
InGoldWeTrust reports:
In the trading week from January 20 – 24 physical gold withdrawn from the SGE vaults accounted for 57 tons, this is the third week in a row SGE withdrawals have been more than weekly global mine production. In the first 24 days of 2014 withdrawals from the SGE accounted for 216 tons. With one trading week left this month it’s very likely January 2014 will break the all time record of monthly withdrawals, surpassing the 236 tons from April 2013.
Side note: Chinese buying helped stabilize gold prices last year as ETFs sold gold by the boatload. All those boatloads ended up in China.
Assets in bullion-backed ETPs shrank 869.1 tons, or 33%, last year, declining for the first time since the first product was introduced in 2003, data compiled by Bloomberg shows. Holdings totaled 1,737 metric tons on Feb. 7.
Usage by China’s jewelry industry climbed 43% to 716.5 tons in 2013, according to the association’s data. Consumption of bars rose 57% to 375.7 tons, while coin demand slipped 1% to 25 tons, the data showed. Industrial use was 48.7 tons and other use 10.4 tons, it said.
Sean's note: With ETF selling winding down, where will the Chinese get their gold supply from now?
3. The US Dollar Is Weak
(Updated chart)
Since gold is priced in U.S. dollars, they usually move in opposite directions. And for the last week, the dollar has been weaker.
The Dollar Index fell nearly 1% last week on a combination of euro strength and “ho-hum” economic data throughout the week. The euro rallied just over 1% to a two week high, after the ECB again provided no economic stimulus despite the ever increasing threat of deflation. Both the Fed and ECB remain relatively comfortable with current policy.
Looking at the chart, one might expect that the US Dollar Index (as tracked by UUP) would reach the bottom of its range, then head higher. And that might weigh on gold. However, ranges are made to be broken. If the dollar breaks down, it's a whole new ballgame.
Dollar bulls can take comfort from the fact that the Euro is on slippery ground.
Next comes $1,300, but that's more psychological than anything. And after that, Gold will need to break through the $1,327 level. IF -- and I say IF -- gold can do that, then we'll be back in a bull market.
Now, here is some of what I am watching on gold ...
1. It's Official -- Chinese Gold Imports Surged in 2013
China's gold consumption jumped 41% in 2013 to exceed 1,000 tonnes for the first time, an industry body said on Monday, as a sharp slide in prices attracted buyers for jewellery and bullion.
The demand surge has helped China become the No. 1 gold consumer and should support prices, which took a hit last year from expectations of a tapering of commodities-friendly economic stimulus by the US Federal Reserve and a drop in demand in the other major buyer India.
Some highlights from the story ...
- Gold consumption in China grew to 1,176.40 tonnes last year, with jewellery demand climbing 43% to 716.50 tonnes and bullion demand soaring 57% to 375.73 tonnes.
- The 28% drop in prices in 2013 attracted a lot of Chinese consumers looking for bargains
- China's 2013 gold imports from Hong Kong more than doubled from the previous year to reach a record 1,158.162 tonnes.
- China's gold output in 2013 rose 6.2% from the previous year to a record high 428.163 tonnes, making the country the world's biggest producer for a seventh straight year.
- China's gold consumption figures do not include demand from the central bank, whose gold reserves stand at 33.89 million ounces (1,054 tonnes), unchanged since April 2009
- China's foreign exchange reserves, the world's largest, rose to $3.82 trillion at the end of 2013.
2. Shanghai Gold Sales Soar
InGoldWeTrust reports:
In the trading week from January 20 – 24 physical gold withdrawn from the SGE vaults accounted for 57 tons, this is the third week in a row SGE withdrawals have been more than weekly global mine production. In the first 24 days of 2014 withdrawals from the SGE accounted for 216 tons. With one trading week left this month it’s very likely January 2014 will break the all time record of monthly withdrawals, surpassing the 236 tons from April 2013.
Side note: Chinese buying helped stabilize gold prices last year as ETFs sold gold by the boatload. All those boatloads ended up in China.
Assets in bullion-backed ETPs shrank 869.1 tons, or 33%, last year, declining for the first time since the first product was introduced in 2003, data compiled by Bloomberg shows. Holdings totaled 1,737 metric tons on Feb. 7.
Usage by China’s jewelry industry climbed 43% to 716.5 tons in 2013, according to the association’s data. Consumption of bars rose 57% to 375.7 tons, while coin demand slipped 1% to 25 tons, the data showed. Industrial use was 48.7 tons and other use 10.4 tons, it said.
Sean's note: With ETF selling winding down, where will the Chinese get their gold supply from now?
3. The US Dollar Is Weak
(Updated chart)
Since gold is priced in U.S. dollars, they usually move in opposite directions. And for the last week, the dollar has been weaker.
The Dollar Index fell nearly 1% last week on a combination of euro strength and “ho-hum” economic data throughout the week. The euro rallied just over 1% to a two week high, after the ECB again provided no economic stimulus despite the ever increasing threat of deflation. Both the Fed and ECB remain relatively comfortable with current policy.
Looking at the chart, one might expect that the US Dollar Index (as tracked by UUP) would reach the bottom of its range, then head higher. And that might weigh on gold. However, ranges are made to be broken. If the dollar breaks down, it's a whole new ballgame.
Dollar bulls can take comfort from the fact that the Euro is on slippery ground.
Thursday, December 26, 2013
Updated: Gold, the US Dollar, and the See-Saw of Pain
Here's an update on my gold versus the US dollar chart ...
Updated chart
The See-Saw of Pain seems to be working in gold's favor, if briefly. We'll see what next week/next year brings.
Updated chart
The See-Saw of Pain seems to be working in gold's favor, if briefly. We'll see what next week/next year brings.
Wednesday, December 11, 2013
Gold, the US Dollar, and the Seesaw of Pain
For a long time, the relationships between gold and the US dollar have
been out of whack. Usually they're on what I call the "seesaw of pain"
-- when one goes up, the other goes. down. But for months, they've moved
in the same direction, as you'll see on this chart.
(Updated chart)
As you can also see on the far right side of this chart, in the past week, we've seen gold head higher while the US dollar goes lower. That's the first time this has happened since mid-October, which was itself a change from the previous trend. Is the relationship between gold and the dollar back to normal? And if so, why?
Here's another question: Why is the US dollar slumping? The economy is improving. The November jobs report was solid. 3rd quarter GDP was revised up to +3.6%, in line with the recent stronger ISM manufacturing readings. Motor vehicle sales for November also made a post-recession high. Gasoline usage is up year over year and is expected to keep increasing, another sign of economic health. And Congress has worked out a budget deal that should prevent another painful battle in Washington. In short, while America's road to recovery may be painfully slow, we seem to be picking up speed. And at least we're going faster than Europe.
But maybe it's a relative expectations game. And I'm talking expectations about the euro and to a lesser extent, the British pound.
On Monday and Tuesday, there was a European Finance Ministers meeting. The european finance ministers made real progress on a banking union framework. Why is that important? Because it would once and for all remove the potential for individual banks (like those in Greece, Spain, Ireland, Italy, etc.) to bankrupt an entire EU country.
A banking union will create a central European regulator to close troubled banks and create a centralized European fund to recapitalize banks and make depositors whole again.
The main sticking point was the Germans, because they know they'll be writing the checks. But they seem to be over it now.
And this is a real fundamental positive for Europe. If you can take a potential future financial crisis off the table, Europe looks a lot more attractive.
The other development was that Bank of England head Marc Carney made a speech in New York. He acknowledged that the UK economy is recovering. He also said that the UK will need low rates into the future. But anyone with eyes can see that Britain's housing prices are skyrocketing. Add in an improving economy, and it's likely that the UK will raise its benchmark interest rate sooner rather than later.
So, if the outlook for both the euro and the pound sterling is improving, then relatively speaking, the US dollar loses some of its safe haven status. And that, I believe, is why the US dollar is going lower ... and also part of why gold is suddenly looking better.
The other part of gold's recent perkiness is Chinese demand for gold, which is enormous and growing. But I'll write more on that another time, as well as selling of gold by exchange-traded products. That may be winding down.
Stay tuned.
Thursday, November 14, 2013
Gold Is Up and the Dollar Is Down -- Chart
I thought we'd revisit a chart I keep posting of the relationship of between the US dollar and gold -- the "seesaw of pain" as I call it.
You can see that this morning, gold gapped higher while the US dollar continues to bleed lower. The day's not over yet -- anything can happen -- but this is a potential set-up for a rally in gold and a pullback in the US dollar. Since the US dollar's larger trend is down, maybe we'll see a resumption of that trend. But be sure to wait and see how the day ends.
Naturally, seeing how the dollar ends the week would be even better.
What seemed to spark this was the prepared testimony of Federal Reserve Chair nominee Janet Yellen, which was released late Wednesday afternoon. Yellen said she would continue current Fed Chairman Ben Bernanke’s monetary policies and said the U.S. economy still needs monetary stimulus because it is performing below its potential. The market place read Yellen’s remarks as dovish monetary policy.
This gave gold a lift yesterday afternoon, but REALLY put a fire under the broad stock market. The action in gold is more short-covering. We need to see follow-through. Gold and silver remain totally at the mercy of tapering expectations.
What could help the dollar (and hurt gold) is if the European Central Bank cranks up its easy money policies. That would probably push the euro lower and boost the dollar.
However, for now, I'll take the good news where I can find it. This is helpful for the three gold mining positions we entered in Gold & Resource Trader this week.
More Gold News
In other gold news, Bloomberg reports -- quoting The World Gold Council -- that in the third quarter, global gold demand slipped to 868.5 metric tonnes, from 1,101.4 tonnes a year earlier. Investors pulled 118.7 tons out of ETFs and similar products, while buying from central banks was 17% lower than a year ago. So, central banks are still buying, but at a lower rate.
Also, China’s demand for jewelry, bars and coins rose 30% to 996.3 metric tonnes, while usage in India gained 24% to 977.6 tonnes. So it's a continuation of the big shift from West to East.
Finally, as of November 13, holdings in gold-bullion-backed exchange-traded products stood at 1,873.3 tonnes. That is down 29% from the beginning of the year, but selling seems to have subsided, and holdings in the gold ETPs seems to be hammering out a bottom. We'll see.
Subscribe to:
Posts (Atom)