Showing posts with label shale. Show all posts

Monday, October 27, 2014

Chart of the Day -- Winners and Losers from Low Oil Prices

The price of Brent crude fell over 25% from $115 a barrel in mid-July to under $85 in mid-October. Who wins and who loses from lower oil prices? This chart provides some answers ...

Source

  • A 10% change in the oil price is associated with around a 0.2% change in global GDP. A price fall normally boosts GDP by shifting resources from producers to consumers.
  • Saudi Arabia can survive low prices because, when oil was $100 a barrel, it saved more of the windfall than it spent. The biggest losers are countries that didn't. Notable among these are three vitriolic critics of America: Venezuela, Iran and Russia
  • However,Russia now has reserves of $454 billion to cushion against oil-price fluctuations.
  • China is the world's second-largest net importer of oil. Every $1 drop in the oil price saves it an annual $2.1 billion. The recent fall, if sustained, lowers its import bill by $60 billion, or 3%. Meanwhile, the cost of goods its exports should remain fairly stable. China is a big winner.
  • Energy imports into the European Union cost $500 billion in 2013, of which 75% was oil. So if oil prices stay at $85, the overall import bill could fall to under $400 billion a year.
  • America  is simultaneously the world's largest consumer, importer and producer of oil. Analysts at Goldman Sachs reckon that cheaper oil and lower interest rates should add about 0.1 percentage points to U.S. growth in 2015.
  • A $20 drop in the world oil price reduces American producers' profits by 20%. Only four-fifths of shale reserves are economic to extract using current technology with Brent around $85. However, that's starting from scratch -- shale oil wells that are already producing will likely keep pumping even if the price falls.

More HERE

Tuesday, October 21, 2014

Charts -- US Oil Imports Go Down, Down Down

This morning, I read that U.S. crude output rose 0.9% to 8.95 million barrels a day in the week ended Oct. 10. That's the most since June 1985, according to Energy Information Administration data. 

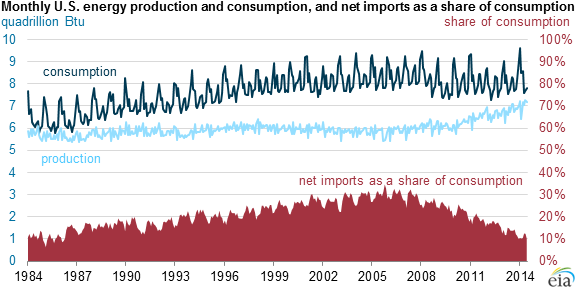
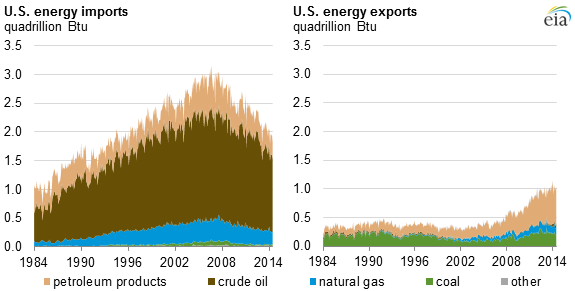
Some charts from the Energy Information Administration on U.S. energy consumption and imports are eyepopping.

First, total U.S. net imports of energy as a share of energy consumption fell to their lowest level in 29 years for the first six months of 2014.


American energy consumption grew, but it was outpaced by the rise in total energy production. As a result, we saw a 17% reduction in net imports compared with the first six months of 2013.

If you're wondering how the rise in U.S. energy production breaks down, petroleum accounted for 52% of the 2014 year-to-date increase, natural gas for 27%, renewable energy for 9%, and nuclear electric power for 2%. In contrast, total coal production fell 1%.


Total energy imports in the first six months of 2014 fell 6% compared with the first six months of 2013. Total energy exports increased 8% compared with the first six months of 2013. The increase was almost entirely the result of a 21% increase in petroleum product exports.

Read the whole EIA report HERE.

Meanwhile, there is support for the U.S. oil benchmark, West Texas Intermediate, around $75 per barrel.

And here is a chart showing breakeven prices among the U.S. shale plays. Notice that the costs in the Eagle Ford are generally a lot lower than in the Permian.

Also, crude oil processing volumes in China reached a record high. However, Chinese refiners are facing a "triple whammy" -- slowing economic growth, state price controls, and now a plunge in the value of stockpiled petroleum.

Just some things to keep in mind today.

And let's look at that oil price chart one more time.

(Updated chart)

A bounce looks likely, but there's no law saying it has to happen.

have a good Tuesday,

Sean

Wednesday, June 4, 2014

My Recent Articles on Palladium, Shale, Nickel, Oil

Here are some recent articles I've written.

It's San Andreas' Fault

Excerpt:

Last week, the EIA said that it expects to release a new detailed estimate on the recoverable amount of oil from the Monterey Shale in California. You could hear jaws dropping all over the California oil patch when the EIA announced its preliminary findings. According to the EIA’s revised estimates, the Monterey Shale contains only about 600 million barrels of oil. That’s 96% less than the 13.7 billion barrels previously predicted.

In one stroke, the EIA put an end to California Dreamin’ about vast, new oil wealth. The EIA’s revision also slashed America’s total recoverable shale oil estimate by two-thirds. That’s because the Monterey Shale represents a huge part of America’s undeveloped shale oil deposits.

“Not all reserves are created equal,” EIA Administrator Adam Sieminski told reporters at the Financial Times and Energy Intelligence Oil & Gas Summit in New York. “It just turned out it’s harder to frack that reserve and get it out of the ground.”

It’s true things look bad. However, the EIA’s latest report is not the last word on this topic. Let’s take a brief look at the challenges facing drillers in the Monterey Shale, why the EIA changed its mind on how much oil can be recovered… and why I think they’ll change their minds AGAIN down the road.

The Rodney Dangerfield of Metals Gets Respect

Excerpt:

Palladium recently jumped to $830 an ounce. Soon, it could challenge its 2011 highs just above $860. And once it gets above that, I think we’ll easily see another 10% rally. But how about longer term?

So let’s take a look at three factors that are greatly affecting the palladium supply and demand picture.

The Nickel Supply Squeeze Is Just Getting Started

Excerpt:

... the supply/demand squeeze powering nickel's surge is likely to get stronger.
The biggest user of nickel is China. Nickel is used to make stainless steel, and China makes a lot of it. Stockpiles of nickel in China are falling. According to Deutsche Bank, China's nickel stockpile is now down to one month's supply, a drop of 26% in just a month.

A big supply crunch is coming for China.

What's more, the global nickel market will swing to a deficit of 132,200 tons next year from a surplus of 13,800 tons this year, according to Citigroup.

What will that do to prices? The price of nickel was recently $8.91 per pound, or $19,615 per metric ton. Citi forecasts nickel prices to rise to more than $30,000 per metric ton next year. That's a rise of more than 50%!

The Oil Boom Has Reached a Tipping Point

Excerpt:

U.S. exports of gasoline, diesel and other petroleum products jumped to a record 4.3 million barrels per day (bpd) at the end of last year, according to the Energy Information Administration (EIA). That's more than twice the 2.1 million bpd of petroleum products that the U.S. imported.

As a result, total U.S. net imports of energy declined last year to their lowest level in more than 20 years!