Thursday, May 29, 2014

Updated US GDP Analysis -- Mind the Shrinkage

On May 5, I posted about US GDP. Back then, everyone was concerned about potential GDP shrinkage of 0.1%.  Turns out it was just revised today to a drop of 1%.


In fact, this was lower than the consensus estimate of a 0.5% decline.

We are hearing many excuses for the shrinkage. Many economists are blaming the weather.  In addition there was there was a drop in private inventories. And that certainly subtracted 1.62 percentage points from growth, way up from the 0.57 percentage points in the first estimate.

At the same time, personal consumption expenditures growth was revised slightly higher to 3.1% from 3.0%; however, that only bumped up the contribution to GDP to 2.09 percentage points from 2.05 percentage points.

Real final sales of domestic product, which excludes the change in inventories, rose just 0.6%.

Bottom line: First quarter economic activity was a disappointment that can't be explained away simply by the weather.

More importantly, how is the market taking the news? Quite well, actually, with stocks rallying and bond yields dropping like hot turds out of the wrong end of a horse.

Why is the market rallying? Because the shrinkage in GDP makes it less likely that the US Fed will stop the easy money party anytime soon. This is a theme I have been exploring with Gold & Resource Trader subscribers for the past two weeks, and we are investing accordingly.

Update on US Dollar Chart

I've been busy all month, and haven't had a chance to update the blog. My apologies.

On May 1, I posted a chart of the US Dollar Index, talking about the potential for the dollar to rally in May, as it has every May for the past 5 years.  I also had a story in FreeMarketCafe.com's Daily Grind that explained the Dollar's May rally effect in more detail. I called it "The Single Most Successful Investment in May."

Time for an updated chart ...

(updated chart)

So how does the US dollar perform in June ... or in the rest of the year? Here's a chart ...


Maybe it's time to bank those dollar profits, if you got 'em. 

Monday, May 5, 2014

One Reason GDP Came in Below Expectations

Some people were shocked by how low the U.S. Q1 GDP number was last week. It's not that surprising, considering how much of a drag austerity is ...

You can read an analysis of this HERE.

The good news is the recovery should continue to limp along.

Thursday, May 1, 2014

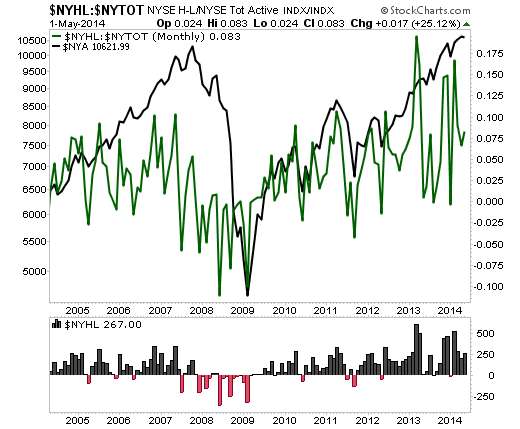
Chart of New Highs Isn't Bearish

Twitter was abuzz with the view that the New Highs on the NYSE Composite stocks were falling off a cliff.  That's not true. 

Visit StockCharts.com to see more great charts.

(Updated chart)

In general, a stock index is deemed strong (bullish) when Net New Highs is positive, which means new highs exceed new lows. Conversely, a stock index is deemed weak (bearish) when Net New Highs is negative, which means new lows exceed new highs.

That said, I'm not bullish on stocks right now. In fact, to point out one example, the action in the Nasdaq-100 as tracked by the Powershares QQQ Trust (QQQs) was pretty bearish today, as it tried to retake its 50-day moving average and failed ... again.

We'll see if stocks can move from where they are now, which is stuck in the mud.

US Dollar at Support -- Will it Break Down or Bounce?

It's time to place your bets folks. The US dollar is at support ...
(Updated chart)

Over the past five years, the US dollar has rallied every May. Is that going to happen this time around? We'll see.  As for gold -- Dollar weakness isn't helping it. Maybe dollar strength will help.