In such an environment, earnings become very, very important.
The Q4 2015 earnings growth estimate for the S&P 500 is now -4.3%.(Source: Thomson Reuters I/B/E/S.)
15% of the S&P 500 companies have reported Q4 2015 EPS. Of the 73 companies in the S&P 500 that have reported earnings to date for Q4 2015, 73% have reported earnings above analyst expectations, if you listen to Thomson Reuters.
Or, 64% of S&P 500 companies have beaten earnings if you listen to Bespoke.

In a typical quarter (since 1994), 63% of companies beat estimates. So 64% to 73% is good. The beat on revenues ... eh, it's not so hot.
How about going forward? The Q1 2016 earnings growth estimate for the S&P 500 is -0.6%. (Factset, another information provider, has the same numbers).
And remember, since most companies beat earnings, odds favor earnings turning out positive if conditions remain the same.
Next week is the peak of earnings season. Fully 50% of the S&P 500 is reporting. Brace for impact.
Another chart, from Deutsche Bank via Value Walk, shows earnings by sector, and also quarterly results ...

Deutsche Bank says the market's correction is a "profit recession' centered just in certain industries. Anyone who guesses Energy leads the way lower gets a gold star.

Wow, the Energy Sector is expected to suffer a whopping 70% drop in earnings for the fourth quarter. Never mind "wow." Ow!
Next week is the peak of earnings season. Fully 50% of the S&P 500 is reporting. Brace for impact.
And now for the two most important charts. First, an update on the Chart of DOOOM!

You can see that the S&P 500 just tested support from last year's low ... a low that was also support in 2014. That support held, and it seems to be a bottom.
But is it "the" bottom?
Now, here's a chart of the S&P 500's forward price-to-earnings ratio, to see where it ended the week ...
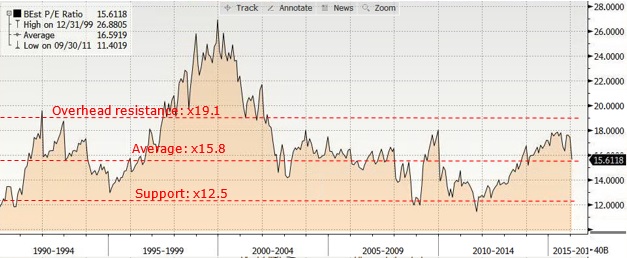
At 15.61, the forward price-to-earnings ratio of the S&P 500 is just below the longer-term average. And that's during a time when earnings estimates are trending negative.
The S&P 500 is many things. But the broad index is not cheap on a valuation basis. Not right now.
That doesn't mean it can't go higher from here, of course. On my Facebook page, I talked about how both China and Europe have opened up the sluice gates of easy money. That's what sparked this week's rally.
Hmm ... could the U.S. Fed follow suit and open up its own QE sluicegate?
That's the trillion-dollar question.
In any case -- Fed QE or not -- remember, a bear market will be over before you know it.
This comment has been removed by the author.
ReplyDelete"But the broad index is not cheap on a valuation basis."
ReplyDeleteThat all depends. If you had a hundred billion dollars in AUM, where else would you want to invest it right now? Bonds? Money market?
Return on capital has decreased because of the global savings glut. That means share prices should have a higher earnings multiple.
Though for sure a high-multiple equilibrium is less stable than a low-multiple one. But does that mean that your strategy should be to keep your $100 billion AUM in cash so you have a big pile to deploy after a market crash? Is the danger of a crash high enough to make it worthwhile to turn your back on a yearly 3% dividend from General Electric?
I believe solid companies that pay nice dividends -- and regularly grow those dividends -- are a good investment now. But everyone has his or her own appetite for risk.
ReplyDelete