Monday, February 22, 2016

The Difference between Silver and Leveraged Silver Producers

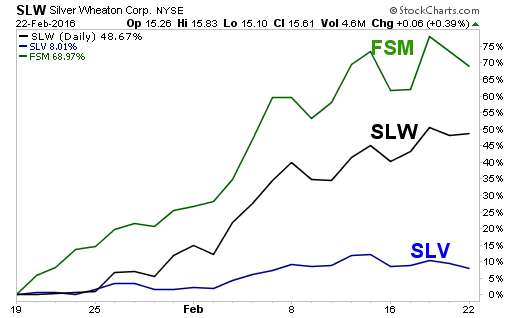
Here's 3 silver picks of mine. The silver ETF (SLV) is the "safe" play. Look how the leveraged silver producers outperform it.


Visit StockCharts.com to see more great charts.

(Updated chart)


$WTIC tests its downtrend

Check out this chart from StockCharts.com for $WTIC


Visit StockCharts.com to see more great charts.

(Updated chart)


$GOLD Chart hasn't looked this bullish since 2009

Unless things get much worse for $GOLD in a hurry, it is about to see its 50-day moving average cross up through its 200-day moving average. This is confirmed by price action; we've seen a big rally. This confluence of events hasn't occurred since February 2009.

We have seen the 50-day cross up through the 200-day since then. But it was when the market was ranging and gold prices headed lower, so it lacked a big price rally. For example, the 50-day/200-day crossover in 2012 was accompanied by only a 6% rally at the time the crossover occurred.

Here you have a weekly chart so I've translated the 50-day MA into a 10-period MA, and the 200-day MA into a 40-period MA

Visit StockCharts.com to see more great charts.
(Updated chart)

Maybe I'm being too optimistic. I'll admit that's happened in the past. But this chart looks pretty darned good.

Tuesday, February 16, 2016

Commodity-Linked Earnings Are Flattened

Another point on earnings, which I haven't emphasized enough in my previous writings, is that the main culprit of earnings pain is commodities. Oil prices, copper prices, iron prices, down, down, down.

You can see that while commodity-linked earnings are doing a swan dive, the S&P 500 ex-energy is holding up much better. Still down. But much better.

I don't expect a big change in Q1. I do expect improvement in Q4. Your view may differ. Good luck, however you stand on the oil trade.

China Gets Hit with an Ugly Stick on Monday

Still waiting for things to turn around, I think.

Data Point #1

China's trade data was released Monday, and it continued to show a big rebalancing of the country's economy. Imports tumbled 14.4% year-over-year in January, missing the expected 1.8% gain by a wide margin. Exports also fell short, down 6.6% YoY against an expected 3.6% increase. In dollar terms, the import side of the ledger looked even more terrifying, down 18.8% compared with the 3.6% drop that was anticipated. 

Data Point #2

Bad loans at Chinese banks are at their highest level in nearly a decadeNonperforming loans at Chinese banks surged 51% year-over-year to 1.27 trillion, hitting their highest level since June 2006. Data released by the China Banking Regulatory Commission (CBRC) on Monday said China's bad-loan ratio climbed to 1.67% of assets from 1.25% in 2014, according to Bloomberg. "Three developments are potentially worrisome: half of all loans are linked, directly or indirectly, to China's overheated real-estate market; unregulated shadow banking accounts for nearly half of new lending; and the debt of many local governments is probably unsustainable," McKinsey Global Institute said. The Chinese yuan weakened 0.3% to 6.5133 per dollar.

Source for both: http://www.businessinsider.com/opening-bell-february-16-2016-2016-2

Monday, February 15, 2016

Gold is on the Cusp of a New Bull Market

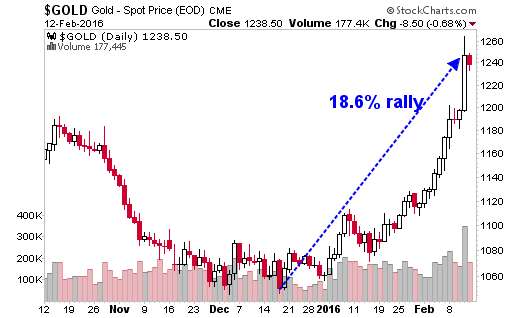
Gold closed Thursday up 18.6% off its closing low on 12/17/15, a low it hit one day after the Fed hiked rates.  If gold reaches a gain of +20%, it will market a new bull market for the yellow metal. 

That would end gold's bear market. And that bear market has already lasted more than 1,500 days. That makes it gold's second longest bear market on record behind the 1,900-day bear that ran from December 1987 to 1993.

Visit StockCharts.com to see more great charts.
(Updated chart)

Whatever your plans are, good luck in this wild market.

When Will The Earnings Recession End?

As I have explained in a couple of blog posts (here and here, etc.), we are in an earnings recession. That is, S&P 500 earnings are getting worse. This is different from an economic recession. In fact, there is plenty of evidence that the economy is improving, despite what political scare-meisters want you to believe.

How can earnings get worse if the economy is improving? It's a devil's trifecta of a too-strong dollar, low oil prices that hammer energy sector earnings (also bank earnings, because they're ones holding loans for the energy companies) and global economic growth that is too slow to sustain previously optimistic earnings expectations.

After all, if you're an S&P 500 company that sells all over the world, and Europe is teetering on the brink of recession, that's really going to hurt your earnings potential. Doubly so if you are manufacturing in US dollar terms and trying to make a profit in euro terms. Until recently, that was a bad trade.

The good news is that, thanks to external forces, the Fed's threat to keep raising interest rates (which supported a strong dollar) seems as empty as a bag of campaign promises.

So, let's take a look at the latest earnings projections for both Q4 2015 and Q1 2016.

Q4 2015 ... Down, but Not as Bad as Was Feared

According to data from ValueWalk, I would describe earnings for Q4 as "bad, but improving." Aggregate fourth quarter estimates  stand at $29.06 as of Friday. That is a 4.9% year over year decline. A week earlier, the estimate stood at $28.99, representing a 5.11% decline year over year,

By sector, telecommunications is leading the way higher, while Energy is the biggest laggard. If you're surprised energy is a laggard, my recommendation is you sell all your stocks and go buy an index fund.


(Source)

Q1 2016 ... Getting Worse

Earnings estimates for Q1 continue to get worse. Most recently the estimate for the broad S&P 500 is a 5.06% decline year over year.


Here's the thing. On Thursday, the S&P 500 has a forward 12-month P/E ratio of 15.2x. That was the lowest in two years and down 13% from 17.4x at the start of 2016, according to Bloomberg data.


(Source)

Bloomberg estimates that full-year S&P earnings will rise 4%. That's not in line with ValueWalk's numbers.

Well, the lowest forward P/E ratio in two years sounds like a bottom, right? No wonder everybody bought the market on Friday.

Still, the S&P 500 probably hasn't fallen far enough to reflect the rapidly lowering Q1 earnings numbers. And there's another thing. Bloomberg takes an awfully short-term view of the market. Maybe that's how traders think. But let's take a little longer-term view, by revisiting a chart I've shown you a couple times.


You can see that at Friday's close, the S&P 500 had a forward P/E of 15.5. That is just slightly below average. That is no where near support. And if earnings estimates are getting worse, I would expect the S&P 500 to fall further. 

Individual sectors will outperform, and individual stocks, certainly. This has become a stock-pickers market.

By the way, ValueWalk expects earnings will fall, year over year, in Q3. But by Q4, their consensus is that earnings will start to grow again.

So that's the good news. When will the market start pricing that in? My crystal ball is cloudy.

And everyone disagrees on earnings estimate. Zacks, which seems particularly bearish to me, has earnings estimates HERE. They also cover the Russell 2000, which is interesting.

The latest Thomson Reuters earnings dashboard I can find is from February 9th. You can look at that HERE.  At the time, T/R was calling for a 4.1% decline in S&P 500 Q4 earnings. That's slightly better than ValueWalk. The T/R outlook for Q1 is a 4.2% decline in earnings.

By the way, Business Insider has a bearish view on the earnings recession, with some nice charts. You can read that HERE.

One bright ray of hope for the bulls: Investor Sentiment is quite bearish. Usually, that is followed by positive gains in stocks 3- and 6-months down the road.

I hope this helps. Good luck and good trades.


Saturday, February 13, 2016

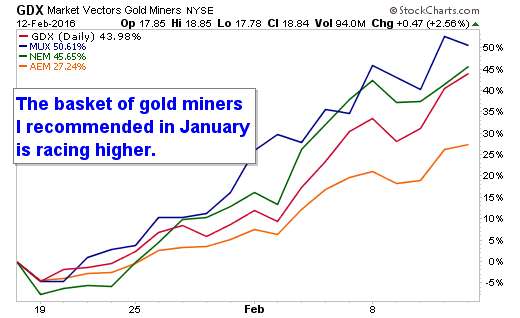
Great Gains on Recommended Gold Miners

In the January 16 issue of Energy & Resources Digest I recommended three undervalued gold miners. Here's how they are doing. I've added the GDX for comparison.
Visit StockCharts.com to see more great charts.

(Updated chart)

Nice gains for less than a month!

And I'm just going to leave a link to a performance chart of some precious metal juniors I talked about in November over here.


Wednesday, February 10, 2016

5 Must-See Charts and Stories on Oil

1. The Coming Wave of Oil Refugees
These countries are not only dependent on oil exports; they also rely heavily on imports. As revenues dry up and exchange rates plunge, the cost of living will skyrocket, exacerbating social and political tensions. Europe is already struggling to accommodate refugees from the Middle East and Afghanistan. Nigeria, Egypt, Angola, and Kenya are among Africa’s most populated countries. Imagine what would happen if they imploded and their disenfranchised, angry, and impoverished residents all started moving north.

2. Oil futures tally a 4-session loss of more than 13%
The U.S. Energy Information Administration cut its 2016 forecasts for West Texas Intermediate and Brent crude prices in a monthly report issued Tuesday. For 2017, the EIA raised its outlook for WTI to $50 from $47, while leaving the Brent forecast at $50. The government agency also reduced its 2016 U.S. oil output forecast to 8.69 million barrels from 8.73 million barrels.

In a separate report Monday, the EIA forecast oil output from major U.S. shale plays to fall by 92,000 barrels a day in March from February.

Nonetheless, increases in U.S. oil inventories, which have now topped 500 million barrels for the first time since 1930, will continue and may peak this year at 517 million barrels in April.

With a “relatively conservative” OPEC supply forecast of 32.7 million barrels a day throughout 2016, the net oversupply averages a “huge” 2 million barrels a day in the first quarter and 1.5 million barrels a day in the second quarter, before easing to 0.3 million barrels a day in second half of the year

3. Cheap oil may trigger a new era of OPEC dominance, warns IEA
According to the IEA, OPEC production could jump back above 50% of global output by the 2030s if the sluggish oil-price environment allows the cartel to pursue its strategy of grabbing more market share.
Sean's note: A five-year price war in oil? Ay-yi-yi!

4. Projection on Shale Spending Growth and Production
Here is a chart from @RystadEnergy showing spending growth post-2016. What's amazing is how little output is seen falling.

5. This is how the oil rout’s ‘endgame’ might play out
Minerd argues that world oil supply and demand should start to balance this year as prices inch closer to the cash cost of production and oil producers defer large amounts of planned investments.

“The global oil surplus of approximately 1.6 million barrels per day in 2015 is likely to evaporate slowly during the course of this year. Global demand growth should absorb 1.2 million barrels while output declines from exhausted fracked wells in the U.S. and other non-OPEC countries should reduce output by about 400,000 barrels in 2016,” Minerd wrote.

He grants that those moves could be offset by increased Iranian production, but expects world demand growth, supported by cheaper prices, to erode much of the surplus and help bring the market into balance by the end of the year (see chart below).


Tuesday, February 9, 2016

Top Gold Stories and Charts Today -- Hot! Hot! Hot!

Yes, I'm bullish gold. And I find these stories interesting ...

UPDATE: Here's my latest ...

Why Gold Will Go From Safe Haven to Highflier in 2016

What if you spotted a rally... and no one believed it?

That’s what’s happening in precious metals right now.

For the first time in four years, investors are piling into gold as a safe haven. Gold has climbed for three straight weeks, the longest rally in 10 months.

And gold miners? Gold miners are on fire!


Look at this chart of year-to-date performance through Friday’s close.


To read the rest, CLICK HERE.

Gold settles near $1,200, at highest level since June.

(Gold as a vengeful beach ball is my favorite mixed metaphor of the week).

“Gold was like a beach ball that had been pushed too low in the water and is now bouncing higher with a vengeance,” Mark O’Byrne, research director at Dublin-based GoldCore, told MarketWatch.


Market participants said this week’s start of the Lunar New Year—a holiday in China and many parts of Asia—was helping drive physical demand for gold.

“While the Chinese Lunar New Year is the high point for Chinese gold demand, it does not drop off significantly afterward as the steady current of growing middle classes continues to attract demand,” said Julian Phillips, a founder and contributor to GoldForecaster.com.

“This is not just a one-off purchase when they become middle class—it signals the start of a continuous purchasing pattern,” he said.

See also The Gold Core Blog, which I like a lot.

SALES OF GOLD COINS SURGE IN EUROPE IN JANUARY
(It's in all caps so you know it must be urgent).

The Austrian Mint, one of Europe's largest in terms of coin sales, said it sold 94,000 ounces of gold coins in January, up 40 percent from 67,100 ounces in January last year.

Britain's Royal Mint said sales of its gold 1 ounce Britannia and Sovereign coins also soared by around 80 percent in January from a year earlier, though it did not give precise sales volumes.

Technician says fan pattern in gold price shows big breakout is coming
(It's from CNBC, so you know it must be true, amiright?)

Gold has a very strong resistance band between $1,150 and $1,180 so any new trend breakout requires a sustained move above $1180.

Goldman No Believer in Gold Rally as Fed to Hike Three Times
(Beware, Ebenezer, for ye shall be visited by three ghosts ...)

“Our economics team forecasts that the Fed will raise rates by 25 basis points three times this calendar year, to 1.3 percent,” analysts including Jeffrey Currie and Max Layton wrote in a report received on Tuesday, forecasting that bullion will trade at $1,000 an ounce by the end of 2016.

The faster growth, as well as the expectations for consumer-price gains, are “forecast to result in an increase in U.S. real interest rates, which under our gold framework is set to drive gold prices down to about $1,000 by year-end,” the analysts wrote.

Goldman forecast that bullion will be at $1,100 in three months, $1,050 in six months and $1,000 in 12 months. The bank said a delay to higher U.S. borrowing costs was an upside risk to its forecasts, while China and Russia cutting bullion purchases would be a downside risk.

Investors have scaled back expectations for U.S. rate rises this year as global equity markets have sunk, oil extended losses and China’s economy slowed. There’s now no chance of an increase next month, down from the 51 percent odds seen at the start of the year, according to data tracked by Bloomberg.

Gold Traders Are Betting on a Bigger Comeback

Eight of the 10 most-traded gold options in New York on Monday were bets on further price gains as the metal topped $1,200 an ounce for the first time since June. More than $2.6 billion was poured into exchange-traded funds tracking precious metals this year, and bullion assets held through ETFs are at the highest since July.


There are more signs pointing to a prolonged rally. The put-to-call ratio, or the number of bearish options trading compared with bullish ones, for SPDR Gold Shares is near the lowest since 2008, data compiled by Bloomberg show. The fund is the world’s biggest ETF backed by gold.


The turnaround for investor sentiment comes as China’s slowdown spurs turmoil for global financial markets. Almost $6.8 trillion has been erased from the value of world equity markets this year. Traders are placing the odds of a U.S. rate increase this year at just 30 percent, down from 85 percent a month ago. Bullion holdings in ETPs have climbed for 15 consecutive days, the longest run since September 2012, according to data compiled by Bloomberg.


LAWRIE WILLIAMS: China still building gold reserves, running down forex
(Hey, Sharps Pixley! Format your posts like you want someone to actually read them, you sadistic small typeface f*cks!)

As the Chinese New Year begins, China is continuing to build its gold reserves at a similar rate to the last six months of last year.  In January it added just over 16 more tonnes to its gold reserve total bringing the official figure to 1,778 tonnes as is being reported to the IMF.  Whether this is a true total or not remains open to doubt given the nation’s history of concealing its full gold reserve position.  If the current rate of purchase continues, and we see no reason why it is likely to be cut back given the nation’s view on the importance of gold in the probably inevitable forthcoming global financial reboot, the country will add another 200 tonnes to its gold reserves this year.

 China's foreign currency stockpile fell nearly $100 billion last month
(China's tumbling yuan -- a managed currency that has nonetheless fallen 5% in a year -- is a major driver of gold's rally, IMO). 

Its foreign exchange reserves dropped $99.5 billion in January to $3.23 trillion, the lowest level since 2012, the central bank said Sunday.

As the Chinese central bank "desperately tries to stabilize the yuan, domestic private investors as well as global currency traders and hedge funds continue to see a one-way bet against the yuan," Biswas wrote in a commentary note.

"This has resulted in large-scale private capital outflows out of the yuan since early 2015, as expectations mount that eventually the [People's Bank of China] will be forced to capitulate once its FX reserves are sufficiently depleted," he said

Let's just look at that again: China’s currency reserves declined by another $100 billion in January. Why another $100 billion? Because China's forex reserves fell $108 billion in December!

Gold price hits one-year high on global recovery
(In other countries, with other currencies, gold is doing better than it is here in the U.S. Hey, maybe my Canadian friends should chime in, since your currency turned into Monopoly money.)

Gold prices on Tuesday traded one-and-a-half-year high in Mumbai's spot market following a sharp recovery in global markets. However, buyers were absent in the market and prices were to be quoted at a huge discount to the cost of imports.

(That seemed like a good one to end with because it reminds us that gold won't go straight up. Buyers will go on strike. Prices will fall. The big question is, "has the trend changed?")

Friday, February 5, 2016

2 Charts -- Testing Support

Here are two charts to make you think.

First, an update on that recent weekly chart of the S&P 500 I've been following, the one showing how this leading index is testing important support.

(Updated chart)
You can see that the S&P 500 closed right at support at its January weekly closing low. That's interesting, eh?


Now, let's put it in perspective with one of my favorite charts, showing U.S. stock movements tracked with the Fed's quantitative easing programs. 

(Updated chart)

You can see that the S&P 500 is right back at that big line of support. 
Meanwhile, QE has ended. The Fed isn't there to push the market higher. 

My third chart on the S&P 500's P/E ratio didn't work out.  If I get the chart over the weekend, I'll add it.

 But the forward p/e stands at 15.58. That's just below the the long-term average of 15.8. So, the S&P 500 is not a bargain despite this week's sell-off.

The Worst Earnings Season in 6 Years

Depending on who you listen to, this is either the worst earnings season in 6 years ... or worse than that.

Thompson Reuters reports that earnings are in for 63% of S&P 500 companies as of Friday morning, Q4 earnings are on track to decline 4.1%. That is worse than the 3.7% retreat forecast at the beginning of the years. This is the biggest drop in six years and follows a 0.8% dip in Q3.

There's a word for this: Earnings recession.


Another, more detailed version here.

Energy earnings are on track to crash 75.3%. Earnings in the materials sector are on track to drop 18%.

What's the problem? Carnage in the oil patch and a too-strong dollar. When the dollar is too strong, it hurts U.S. companies trying to sell goods overseas.

According to Thompson Reuters, Q1 earnings are expected to decline 3.6% to 3.9%. Q2 earnings are expected to fall 0.2%. 

Okay, that's the bad news. Now for the worse news. 

See, Thompson Reuters isn't the only game in town. S&P Global Market Intelligence also does its figures. And it says Q4 earnings are down 5.09% from the fourth quarter of 2014.

We are in an earnings recession. Invest accordingly. 

Thursday, February 4, 2016

What I'm Watching on Gold (And You Should, Too)

The tide in gold seems to have shifted. And I have friends who have already hoisted the Jolly Roger and gone off chasing golden booty already. Apart from some small, longer-term positions, I have not set sail yet. That's because I prefer to trade on weekly closes. And I would like gold (spot) to close above its 200-day moving average.
(Updated chart)

That said, things have been improving for gold and silver for quite some time. And the U.S. dollar's plunge yesterday was the worst in 7 years. Certainly, that bodes well for gold.

Here are my recent stories on the topics of gold and silver. If you click through, you'll find some suggested picks.

February 3rd

Silver's Secret Countdown

January 27th

The Fear Trade Flourishes

January 16th

A Glimmer of Hope for 2016

Also, I give interviews to the fine folks at HoweStreet.com every other week. Here's the latest. I hesitate to link to it because there is always at least one flaming a-hole in the comments. But I've come to expect that.

It will be an interesting end to the week. Stay tuned.

Wednesday, February 3, 2016

All Eyes on Support for S&P 500


It's time to take a look at a shorter-term, close-up of that S&P 500 "DOOOOOM" chart that I've been posting, because the S&P 500 is testing support.


(Updated chart)

Try not to read too much into intraday action. Algos push the market around specifically to frighten investors -- the easier to harvest money from them. I would become concerned if the S&P 500 closes below that January low on a daily basis. My concern would crank to "10" if it closes below that August intraday low on a weekly basis.

Then again, a move lower would not surprise me, as earnings estimates continue to ratchet lower. In lieu of the Fed tapping a new firehose of free money, it all comes down to earnings expectations. And a too-strong U.S. dollar and weak economies overseas are definitely hurting earnings.

Good luck and good trades,

Sean

Tuesday, February 2, 2016

Portfolios With Purpose -- Ka-Ching!

Two items of news on Portfolios with Purpose, the contest I am currently in.

Around 11:00 today, I checked out my PwP positions and saw that Facebook was at the top of the channel, where I previously said I would take profits on HALF the FB call options. I waited an hour to do anything, because that's the minimum time it usually takes to get an issue out the door. The FB January 2017 95 calls had a bid of 29.20 a little after noon. The ask was higher, but you never get filled at the ask price.

Note: I'm just paper-trading the options as a test for a new publication I want to roll out. The underlying stocks are part of the PwP contest I talked about yesterday.

Anyway, I'm following through, and banked gains on half the FB calls. That's a gain of 107% in 12 trading days. The other half of the calls we'll let ride. It's free money now.

And it's a good thing I did. When the Dow dipped way down later in the afternoon, FB turned around and closed lower.


Meanwhile, what about Gilead? Well, it reported earnings at 4:05 pm. Not only did it beat estimates handily, but it also announced a $12 billion share buyback. That sent the stock higher in after-hours trading. We'll see what Wednesday's price action brings.

So, I'm glad I hung on to Gilead. I only did that because it announced approval of one of its new drugs before the market opened on Monday. But sometimes it's better to be lucky than smart.

My PwP positions held up better than the broad market today, but they have been doing that during sell-offs anyway. That's another point in favor of the new trading system I'm working on.