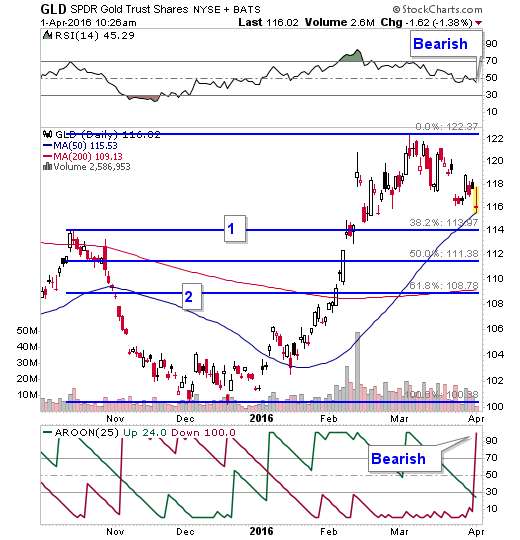
When that's the best that gold can rally under those circumstances, it's in trouble. Here's a chart of the SPDR Gold Trust Shares (GLD).
(Updated chart)
Sure enough, we are seeing real follow-through now.
The bulls will point out that gold is touching its 50-day moving average, which could be support. That may be. However ...
- RSI is falling again after trying to find support. That's bearish.
- Aroon just gave a bearish signal.
It would not surprise me to see the GLD test first Fibonacci support at 113.97 (roughly 114, draw it with a thick crayon). I have marked that line (1) on the chart. That lines up with a peak from last October, which is now support.
That might hold.
If it doesn't, then GLD could test a 61.8% Fibonacci retracement at 108.78. I have marked that line (2) on the chart. That is close to the 200-day moving average as well. And that would be a 6% decline from the recent price.
The 50% retracement offers no support that I can see. So, it's 38% or 61%.
We'll have to see how this plays out. Demand from China, India and ETFs will be crucial. Statements from various Fed governors will probably only confuse the situation (and traders).
Recently, investors have used gold ETFs to load up on gold despite gold's bumpy moves. It will be interesting to see if investors view this pullback as a buying opportunity.
Good luck out there. And have a great weekend.
No comments:
Post a Comment