The US Dollar Index just recently bounced from support around 80.50. Then it tried to get back above its 200-day moving average, and so far it has failed. A failure here would bring another test of support, and potentially a breakdown to test 78.92.
(Updated chart)
But there is even more at stake. The USD Index is also testing a rising trendline drawn under its 2011/2013 lows. A decisive close below that line would end the dollar uptrend that's been in effect for the last two years.
(Updated chart)
If the US dollar breaks that support, what would that do to commodity prices? To the price of oil ... silver ... and gold?
If
the US dollar breaks that support, you ain’t seen nothin’ yet.
"In the Valley of the Blind, the One-Eyed Man Is King." Market charts, analysis and links
Monday, August 26, 2013
US Dollar Tests Important Support ... Charts!
Energy Sector Breakout
Take a look at this chart of the Energy Select Sector SPDR ...
Updated chart
The XLE has a repeating pattern -- a breakout, followed by a ramp-up, followed by a consolidation, then a move up to test that consolidation as overhead resistance. We've just seen the breakout now. This gives us a target of 102 on the XLE. Do your own due diligence.
Updated chart
The XLE has a repeating pattern -- a breakout, followed by a ramp-up, followed by a consolidation, then a move up to test that consolidation as overhead resistance. We've just seen the breakout now. This gives us a target of 102 on the XLE. Do your own due diligence.
Sunday, August 25, 2013
6 Must-Sees for Sunday -- Including 4 Gold Charts
#1: Thirteen Things the Government is Trying to Keep Secret from You
The President, the Head of the National Security Agency, the Department of Justice, the House and Senate Intelligence Committees, and the Judiciary, are intentionally keeping massive amounts of information about surveillance of US and other people secret from voters.Read more.
#2: Barry Ritholtz: How to Avoid Being a Wall Street Muppet
About 10 percent of the new accounts that we see are muppet portfolios. These typically hold hundreds of positions. Mind you, these are not from a family office with $150 million, but a portfolio 1 percent of that size. There is no rational reason for these sorts of assemblages to be holding 100-plus positions.Read More.
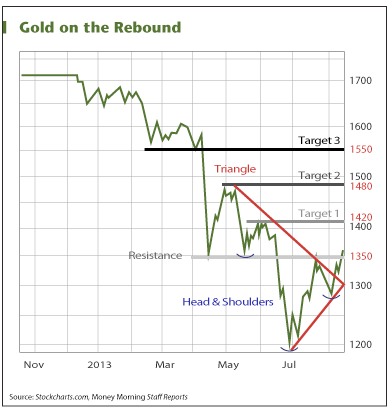
#3: Gold's Breakout Has Only Begun
Source#4: On The Other Hand ...
@AllStarCharts Shows Why He Just Faded Gold ...Source
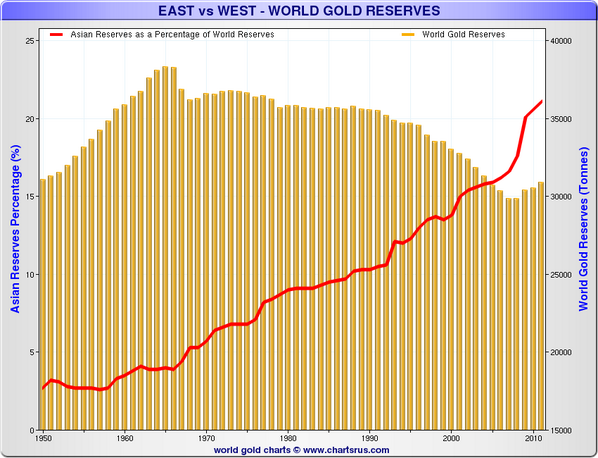
#5: Asia's Gold Reserves as Percent of World Gold Reserves
Source
#6 Physical Gold Delivered on Shanghai Gold Exchange Vs World Mining Production
Source
Shanghai Gold Exchange
- 39 metric tonnes delivered in week 32 (left the SGE vaults), 12-08-2013/16-08-2013
- w/w + 4.93 %
- 1424 metric tonnes delivered year to date
Saturday, August 24, 2013
Here's my newest video on gold, from Friday, August 23rd.
Global Gold Demand, And Why It's About to Change
Courtesy of Reuters ...
Why this is so important: First, India and China should EACH buy 1,000 tonnes of gold this year. Second, exchange-traded-product selling of gold was a major bearish force in the markets through July. But more recently, the SPDR Gold Trust GLD saw its gold holdings rise on Wednesday for the first time since late May.
In other words, the selling pressure that has kept its boot on the neck of gold prices for months may finally be about to lift.
One data point is not a trend. But this may mark the beginning of the bottom in gold. Be careful -- you're in charge of your own investing destiny.
Subscribe to:
Posts (Atom)